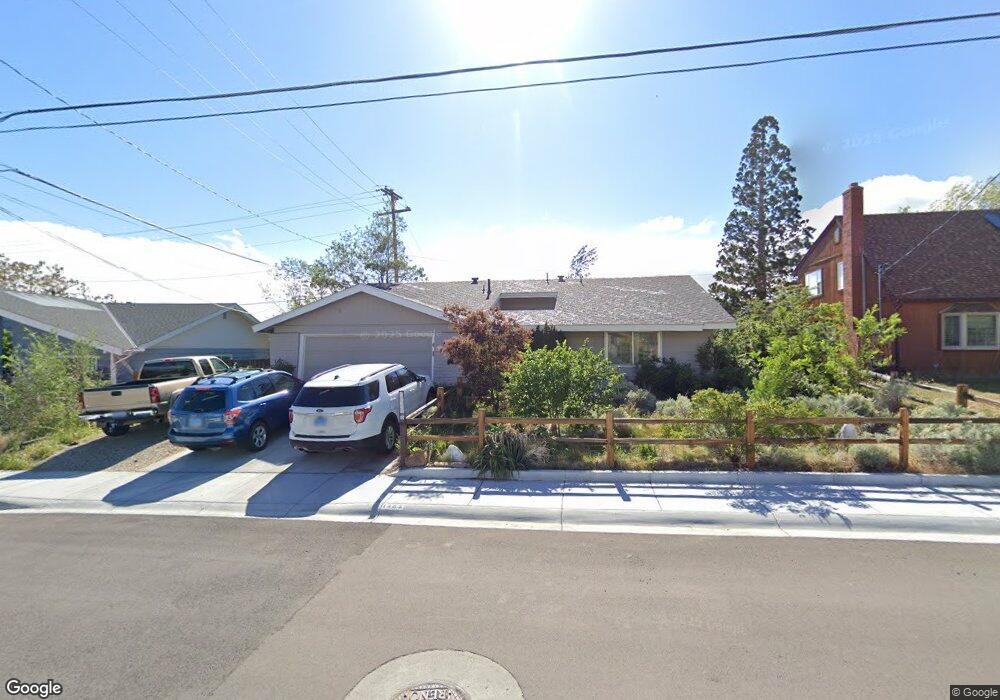
1485 O Farrell St Reno, NV 89503
Kings Row NeighborhoodEstimated Value: $473,000 - $526,000
4
Beds
2
Baths
1,594
Sq Ft
$314/Sq Ft
Est. Value
About This Home
This home is located at 1485 O Farrell St, Reno, NV 89503 and is currently estimated at $500,912, approximately $314 per square foot. 1485 O Farrell St is a home located in Washoe County with nearby schools including Peavine Elementary School, Archie Clayton Pre-AP Academy, and Reno High School.
Ownership History
Date
Name
Owned For
Owner Type
Purchase Details
Closed on
Jun 11, 2002
Sold by
Peters Deanna O
Bought by
Stack Robert N
Current Estimated Value
Home Financials for this Owner
Home Financials are based on the most recent Mortgage that was taken out on this home.
Original Mortgage
$152,004
Outstanding Balance
$64,498
Interest Rate
6.86%
Estimated Equity
$436,414
Purchase Details
Closed on
Feb 16, 2001
Sold by
Schultz Kent E and Schultz Brenda M
Bought by
Peters Deanna O
Home Financials for this Owner
Home Financials are based on the most recent Mortgage that was taken out on this home.
Original Mortgage
$151,050
Interest Rate
6.89%
Purchase Details
Closed on
Apr 14, 1995
Sold by
Ludlow Katherine L
Bought by
Holland Marjorie E
Home Financials for this Owner
Home Financials are based on the most recent Mortgage that was taken out on this home.
Original Mortgage
$133,975
Interest Rate
8.47%
Mortgage Type
FHA
Purchase Details
Closed on
Apr 13, 1995
Sold by
Holland Marjorie E
Bought by
Schultz Kent E and Schultz Brenda M
Home Financials for this Owner
Home Financials are based on the most recent Mortgage that was taken out on this home.
Original Mortgage
$133,975
Interest Rate
8.47%
Mortgage Type
FHA
Create a Home Valuation Report for This Property
The Home Valuation Report is an in-depth analysis detailing your home's value as well as a comparison with similar homes in the area
Home Values in the Area
Average Home Value in this Area
Purchase History
| Date | Buyer | Sale Price | Title Company |
|---|---|---|---|
| Stack Robert N | $151,000 | Stewart Title Northern Nevad | |
| Peters Deanna O | $159,000 | Western Title Inc | |
| Holland Marjorie E | -- | First American Title Company | |
| Schultz Kent E | $136,000 | First American Title Company |
Source: Public Records
Mortgage History
| Date | Status | Borrower | Loan Amount |
|---|---|---|---|
| Open | Stack Robert N | $152,004 | |
| Previous Owner | Peters Deanna O | $151,050 | |
| Previous Owner | Schultz Kent E | $133,975 |
Source: Public Records
Tax History Compared to Growth
Tax History
| Year | Tax Paid | Tax Assessment Tax Assessment Total Assessment is a certain percentage of the fair market value that is determined by local assessors to be the total taxable value of land and additions on the property. | Land | Improvement |
|---|---|---|---|---|
| 2025 | $1,109 | $65,302 | $39,795 | $25,507 |
| 2024 | $1,077 | $62,689 | $37,485 | $25,204 |
| 2023 | $1,077 | $62,518 | $39,200 | $23,318 |
| 2022 | $1,047 | $50,510 | $31,500 | $19,010 |
| 2021 | $1,017 | $39,832 | $21,245 | $18,587 |
| 2020 | $965 | $37,730 | $19,985 | $17,745 |
| 2019 | $937 | $37,111 | $20,300 | $16,811 |
| 2018 | $909 | $30,590 | $14,455 | $16,135 |
| 2017 | $883 | $28,797 | $12,915 | $15,882 |
| 2016 | $861 | $27,266 | $11,340 | $15,926 |
| 2015 | $860 | $25,241 | $9,625 | $15,616 |
| 2014 | $836 | $24,166 | $8,575 | $15,591 |
| 2013 | -- | $22,017 | $6,125 | $15,892 |
Source: Public Records
Map
Nearby Homes
- 1535 Van Ness Ave
- 2815 Severn Dr
- 2920 Harding Cir
- 2645 Emily St
- 1845 Wesley Dr
- 2120 Keystone Ave
- 3190 Cartwright Rd
- 1455 Exeter Way
- 1765 Harold Dr
- 1540 King Edward Dr
- 1935 Marlette Ave
- 3435 Balboa Dr
- 3160 Sky Country Dr
- 1835 Marlette Ave
- 1350 Marne Dr
- 3520 Balboa Dr
- 3235 Bryan St
- 3201 Green River Dr
- 3181 Sky Country Dr
- 1702 Grandview Ave
- 1525 O Farrell St
- 1465 O Farrell St
- 1435 O Farrell St
- 1545 O Farrell St
- 1490 O Farrell St
- 1460 O Farrell St
- 1520 O Farrell St
- 1540 O Farrell St
- 1420 O Farrell St
- 1565 O Farrell St
- 1401 O Farrell St
- 1621 Geary St
- 1560 O Farrell St
- 1615 Geary St
- 1655 Geary St
- 2685 Polk St
- 1615 O Farrell St
- 1625 Geary St
- 2680 Polk St
- 1600 O Farrell St