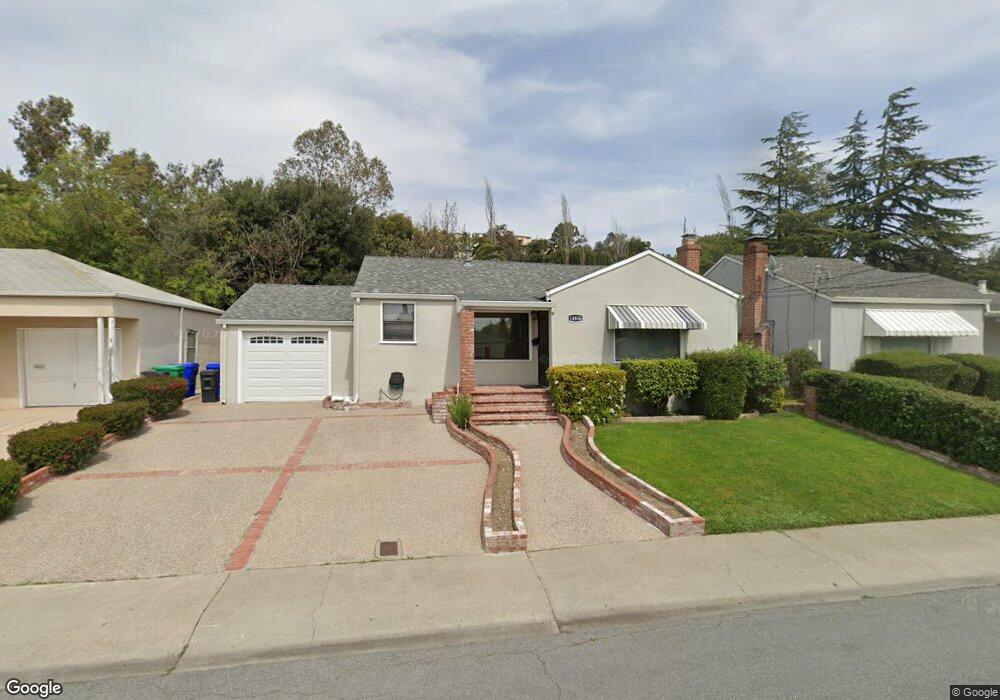
14856 Wake Ave San Leandro, CA 94578
Upper Bal NeighborhoodEstimated Value: $693,000 - $878,000
3
Beds
2
Baths
1,414
Sq Ft
$568/Sq Ft
Est. Value
About This Home
This home is located at 14856 Wake Ave, San Leandro, CA 94578 and is currently estimated at $802,959, approximately $567 per square foot. 14856 Wake Ave is a home located in Alameda County with nearby schools including Jefferson Elementary School, Bancroft Middle School, and San Leandro High School.
Ownership History
Date
Name
Owned For
Owner Type
Purchase Details
Closed on
Jun 5, 2002
Sold by
King Robyn D
Bought by
Quintor Erica and Quintor Luz Delia
Current Estimated Value
Home Financials for this Owner
Home Financials are based on the most recent Mortgage that was taken out on this home.
Original Mortgage
$287,960
Outstanding Balance
$121,153
Interest Rate
6.74%
Estimated Equity
$681,806
Purchase Details
Closed on
Apr 22, 1999
Sold by
King Joan D
Bought by
King Robyn D
Home Financials for this Owner
Home Financials are based on the most recent Mortgage that was taken out on this home.
Original Mortgage
$200,000
Interest Rate
9.25%
Purchase Details
Closed on
Feb 11, 1997
Sold by
King Joan D
Bought by
King Joan D and The Joan D King Family Trust
Purchase Details
Closed on
Aug 28, 1995
Sold by
Michaelides John P and Michaelides Mary Ann
Bought by
King Joan D
Home Financials for this Owner
Home Financials are based on the most recent Mortgage that was taken out on this home.
Original Mortgage
$157,500
Interest Rate
7.63%
Create a Home Valuation Report for This Property
The Home Valuation Report is an in-depth analysis detailing your home's value as well as a comparison with similar homes in the area
Home Values in the Area
Average Home Value in this Area
Purchase History
| Date | Buyer | Sale Price | Title Company |
|---|---|---|---|
| Quintor Erica | $360,000 | Old Republic Title Company | |
| King Robyn D | $200,000 | American Title Co | |
| King Joan D | -- | -- | |
| King Joan D | $175,000 | Northwestern Title Company |
Source: Public Records
Mortgage History
| Date | Status | Borrower | Loan Amount |
|---|---|---|---|
| Open | Quintor Erica | $287,960 | |
| Previous Owner | King Robyn D | $200,000 | |
| Previous Owner | King Joan D | $157,500 |
Source: Public Records
Tax History Compared to Growth
Tax History
| Year | Tax Paid | Tax Assessment Tax Assessment Total Assessment is a certain percentage of the fair market value that is determined by local assessors to be the total taxable value of land and additions on the property. | Land | Improvement |
|---|---|---|---|---|
| 2025 | $7,078 | $531,643 | $159,537 | $372,106 |
| 2024 | $7,078 | $521,220 | $156,409 | $364,811 |
| 2023 | $7,101 | $511,003 | $153,343 | $357,660 |
| 2022 | $6,885 | $500,984 | $150,337 | $350,647 |
| 2021 | $6,689 | $491,161 | $147,389 | $343,772 |
| 2020 | $6,525 | $486,126 | $145,878 | $340,248 |
| 2019 | $6,319 | $476,597 | $143,019 | $333,578 |
| 2018 | $6,138 | $467,254 | $140,215 | $327,039 |
| 2017 | $6,021 | $458,094 | $137,466 | $320,628 |
| 2016 | $5,695 | $449,115 | $134,772 | $314,343 |
| 2015 | $5,588 | $442,370 | $132,748 | $309,622 |
| 2014 | $4,769 | $367,000 | $110,100 | $256,900 |
Source: Public Records
Map
Nearby Homes
- 14960 Portofino Cir
- 0 Saturn Dr
- 14973 Patton Ave
- 14972 Lark St
- 14955 Lark St
- 1947 Placer Dr
- 1939 Placer Dr
- 2230 Sol St
- 2290 Upland Rd
- 1293 Vistagrand Dr
- 15683 Liberty St
- 14875 Western Ave
- 14101 E 14th St Unit 306
- 1112 Adason Dr
- 1207 147th Ave Unit D
- 1203 147th Ave
- 1525 Thrush Ave
- 15806 Maubert Ave
- 1540 Mono Ave
- 1440 Thrush Ave Unit 48
- 14854 Wake Ave
- 14868 Wake Ave
- 14850 Wake Ave
- 14870 Wake Ave
- 14865 Wake Ave
- 14878 Wake Ave
- 14846 Wake Ave
- 14873 Wake Ave
- 14857 Wake Ave
- 14853 Wake Ave
- 14840 Wake Ave
- 14880 Wake Ave
- 14847 Wake Ave
- 1743 Sidney Ave
- 14841 Wake Ave
- 14884 Sylvia Way
- 14832 Wake Ave
- 14872 Sylvia Way
- 1756 Sidney Ave
- 14868 Sylvia Way