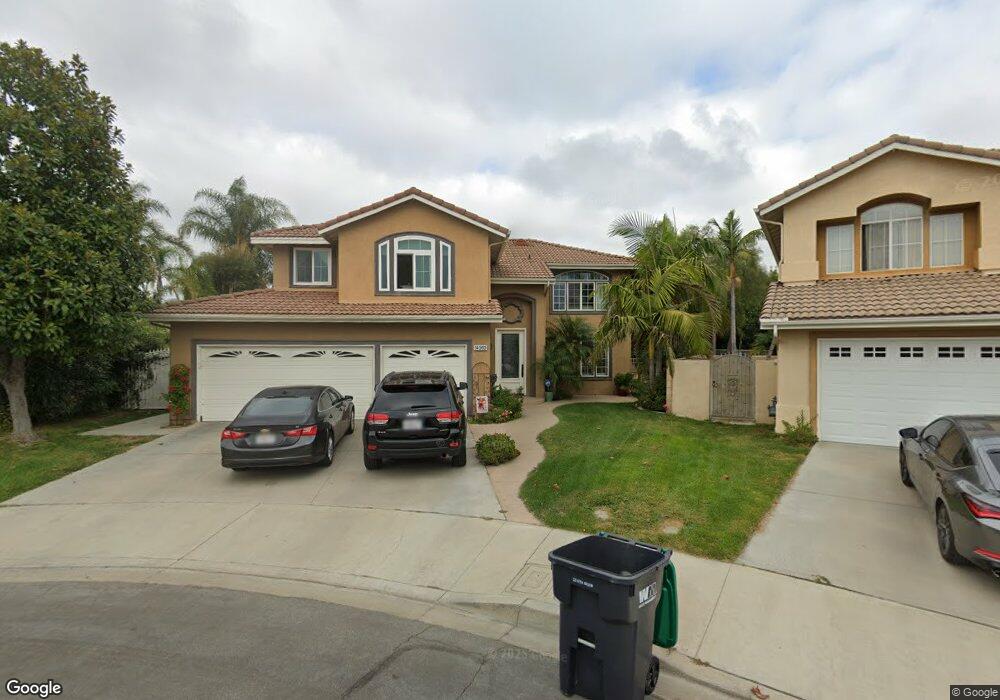
14860 Running Brook Way Chino Hills, CA 91709
North Chino Hills NeighborhoodEstimated Value: $1,305,000 - $1,492,000
5
Beds
4
Baths
2,791
Sq Ft
$496/Sq Ft
Est. Value
About This Home
This home is located at 14860 Running Brook Way, Chino Hills, CA 91709 and is currently estimated at $1,384,582, approximately $496 per square foot. 14860 Running Brook Way is a home located in San Bernardino County with nearby schools including Hidden Trails Elementary School, Canyon Hills Junior High School, and Ruben S. Ayala High School.
Ownership History
Date
Name
Owned For
Owner Type
Purchase Details
Closed on
Mar 9, 2007
Sold by
Beck Scott R and Beck Teresa M
Bought by
Beck Scott R and Beck Teresa M
Current Estimated Value
Purchase Details
Closed on
May 18, 2001
Sold by
Harvey Carl O and Harvey Helen Louise
Bought by
Beck Scott R and Beck Teresa M
Home Financials for this Owner
Home Financials are based on the most recent Mortgage that was taken out on this home.
Original Mortgage
$210,000
Outstanding Balance
$79,110
Interest Rate
7.15%
Estimated Equity
$1,305,472
Purchase Details
Closed on
Jul 16, 1996
Sold by
Lyon & Copley Associates L P
Bought by
Harvey Carl O and Harvey Helen Louise
Home Financials for this Owner
Home Financials are based on the most recent Mortgage that was taken out on this home.
Original Mortgage
$74,900
Interest Rate
8.18%
Create a Home Valuation Report for This Property
The Home Valuation Report is an in-depth analysis detailing your home's value as well as a comparison with similar homes in the area
Home Values in the Area
Average Home Value in this Area
Purchase History
| Date | Buyer | Sale Price | Title Company |
|---|---|---|---|
| Beck Scott R | -- | None Available | |
| Beck Scott R | $399,000 | Gateway Title Company | |
| Harvey Carl O | $253,500 | First American Title Ins Co |
Source: Public Records
Mortgage History
| Date | Status | Borrower | Loan Amount |
|---|---|---|---|
| Open | Beck Scott R | $210,000 | |
| Previous Owner | Harvey Carl O | $74,900 |
Source: Public Records
Tax History Compared to Growth
Tax History
| Year | Tax Paid | Tax Assessment Tax Assessment Total Assessment is a certain percentage of the fair market value that is determined by local assessors to be the total taxable value of land and additions on the property. | Land | Improvement |
|---|---|---|---|---|
| 2025 | $7,017 | $607,954 | $192,503 | $415,451 |
| 2024 | $7,017 | $596,033 | $188,728 | $407,305 |
| 2023 | $6,835 | $584,346 | $185,027 | $399,319 |
| 2022 | $6,796 | $572,888 | $181,399 | $391,489 |
| 2021 | $7,309 | $561,655 | $177,842 | $383,813 |
| 2020 | $7,216 | $555,895 | $176,018 | $379,877 |
| 2019 | $7,095 | $544,995 | $172,567 | $372,428 |
| 2018 | $6,950 | $534,308 | $169,183 | $365,125 |
| 2017 | $6,832 | $523,832 | $165,866 | $357,966 |
| 2016 | $6,442 | $513,561 | $162,614 | $350,947 |
| 2015 | $6,322 | $505,846 | $160,171 | $345,675 |
| 2014 | $6,205 | $495,937 | $157,033 | $338,904 |
Source: Public Records
Map
Nearby Homes
- 1525 Rancho Hills Dr
- 1850 Fairway Dr Unit 47
- 1850 Fairway Dr Unit 48
- 15877 Esquilime Dr
- 2024 Vista Del Sol
- 15030 Camino Arroyo
- 16127 Greens Ct
- 2137 Turquoise Cir
- 15075 Avenida Del Monte
- 2153 Turquoise Cir
- 16179 Lantern Ln
- 16107 Lantern Ln
- 16143 Lantern Ln
- Plan 3 at Serenity Grove
- Plan 1 at Serenity Grove
- Plan 2 at Serenity Grove
- 14269 Sapphire Hill Ln
- 1079 Spring Oak Way
- 2222 Carbon Canyon Rd
- 2 CUTOFF Old Carbon Canyon Rd
- 14870 Running Brook Way
- 14865 Running Brook Way
- 14875 Running Brook Way
- 14880 Running Brook Way
- 14885 Running Brook Way
- 14890 Running Brook Way
- 14822 Avenida Anita
- 14830 Avenida Anita
- 14895 Running Brook Way
- 14814 Avenida Anita
- 14838 Avenida Anita
- 14900 Running Brook Way
- 14806 Avenida Anita
- 14846 Avenida Anita
- 14905 Running Brook Way
- 14798 Avenida Anita
- 14854 Avenida Anita
- 14910 Running Brook Way
- 14790 Avenida Anita
- 14915 Running Brook Way