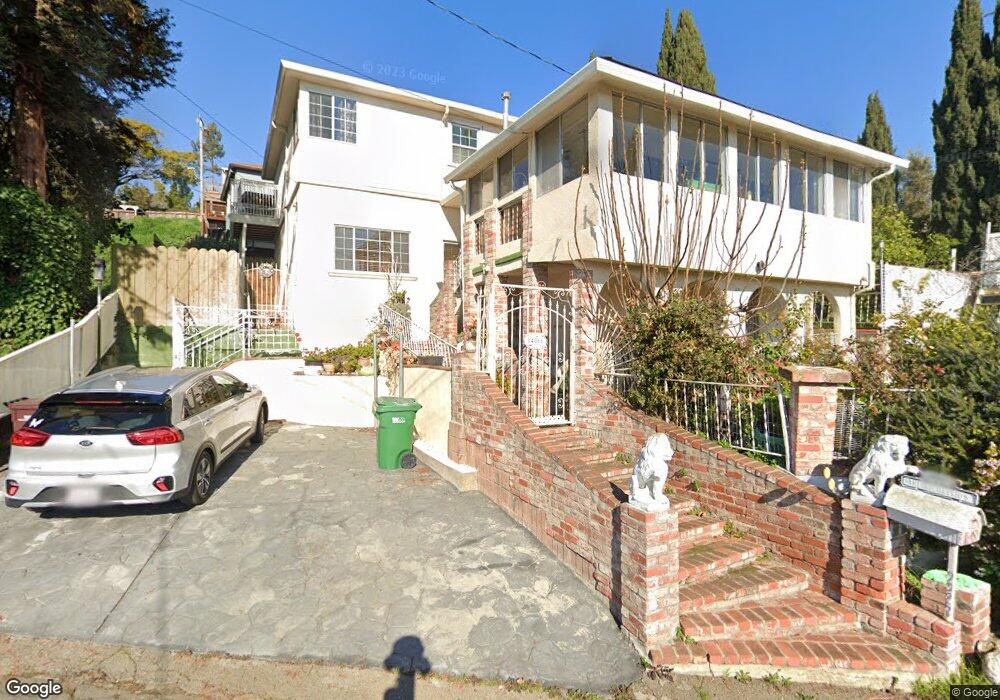
14866 Boulevard Ct San Leandro, CA 94578
Bay-O-Vista NeighborhoodEstimated Value: $820,000 - $883,000
3
Beds
2
Baths
1,680
Sq Ft
$511/Sq Ft
Est. Value
About This Home
This home is located at 14866 Boulevard Ct, San Leandro, CA 94578 and is currently estimated at $858,274, approximately $510 per square foot. 14866 Boulevard Ct is a home located in Alameda County with nearby schools including Corvallis Elementary School, Edendale Middle, and San Lorenzo High School.
Ownership History
Date
Name
Owned For
Owner Type
Purchase Details
Closed on
Jun 20, 2022
Sold by
Norah Myrna Goldassio Living Trust and Goldassio Norah Myna
Bought by
Norah Myrna Goldassio Living Trust and Goldassio
Current Estimated Value
Purchase Details
Closed on
Aug 30, 2021
Sold by
Goldassio Norah Myrna
Bought by
Goldassio Norah Myrna and The Norah Myrna Goldassio Livi
Purchase Details
Closed on
Aug 6, 2021
Sold by
Millis Valerie
Bought by
Goldassio Norah Myrna
Purchase Details
Closed on
Aug 4, 2021
Sold by
Ribelin Brenda
Bought by
Goldassio Norah Myrna
Purchase Details
Closed on
Jul 29, 2021
Sold by
Goldassio Paul
Bought by
Goldassio Norar Myrna
Purchase Details
Closed on
Jul 22, 2021
Sold by
Perry Sabrina S and Goldassio Sabrina
Bought by
Goldassio Norah Myrna
Purchase Details
Closed on
Aug 22, 2012
Sold by
Goldassio Ray J
Bought by
Ribelin Brenda and Millis Valerie
Purchase Details
Closed on
Aug 4, 2000
Sold by
Goldassio Norah Myrna
Bought by
Goldassio Norah Myrna and Goldassio Paul
Create a Home Valuation Report for This Property
The Home Valuation Report is an in-depth analysis detailing your home's value as well as a comparison with similar homes in the area
Home Values in the Area
Average Home Value in this Area
Purchase History
| Date | Buyer | Sale Price | Title Company |
|---|---|---|---|
| Norah Myrna Goldassio Living Trust | -- | None Listed On Document | |
| Goldassio Norah Myrna | -- | None Available | |
| Goldassio Norah Myrna | -- | None Available | |
| Goldassio Norah Myrna | -- | None Available | |
| Goldassio Norar Myrna | -- | None Available | |
| Goldassio Norah Myrna | -- | None Available | |
| Ribelin Brenda | -- | None Available | |
| Goldassio Norah Myrna | -- | -- |
Source: Public Records
Tax History Compared to Growth
Tax History
| Year | Tax Paid | Tax Assessment Tax Assessment Total Assessment is a certain percentage of the fair market value that is determined by local assessors to be the total taxable value of land and additions on the property. | Land | Improvement |
|---|---|---|---|---|
| 2025 | $9,083 | $712,216 | $220,997 | $498,219 |
| 2024 | $9,083 | $698,119 | $216,665 | $488,454 |
| 2023 | $9,046 | $691,293 | $212,417 | $478,876 |
| 2022 | $8,988 | $672,139 | $208,252 | $469,487 |
| 2021 | $2,052 | $108,091 | $82,866 | $32,225 |
| 2020 | $1,993 | $113,912 | $82,017 | $31,895 |
| 2019 | $1,976 | $111,678 | $80,408 | $31,270 |
| 2018 | $1,802 | $109,489 | $78,832 | $30,657 |
| 2017 | $1,724 | $107,342 | $77,286 | $30,056 |
| 2016 | $1,639 | $105,237 | $75,771 | $29,466 |
| 2015 | $1,600 | $103,657 | $74,633 | $29,024 |
| 2014 | $1,575 | $101,627 | $73,172 | $28,455 |
Source: Public Records
Map
Nearby Homes
- 0 Saturn Dr
- 2230 Sol St
- 14972 Lark St
- 14955 Lark St
- 14683 Midland Rd
- 1939 Placer Dr
- 2290 Upland Rd
- 14625 Bancroft Ave
- 1426 153rd Ave
- 14850 Donna St
- 15683 Liberty St
- 2724 Benedict Dr
- 15806 Maubert Ave
- 1293 Vistagrand Dr
- 1525 Thrush Ave
- 15922 Wellington Way
- 1540 Mono Ave
- 15925 Maubert Ave Unit 2
- 1450 Thrush Ave Unit 17
- 15976 Carolyn St
- 14863 Saturn Dr
- 14875 Saturn Dr
- 1970 149th Ave
- 14861 Boulevard Ct
- 14850 Boulevard Ct
- 14871 Boulevard Ct
- 14851 Boulevard Ct
- 14895 Saturn Dr
- 1980 149th Ave
- 14841 Boulevard Ct
- 14849 Saturn Dr
- 14973 Saturn Dr
- 14945 Saturn Dr
- 14957 Saturn Dr
- 14933 Saturn Dr
- 14923 Saturn Dr
- 14837 Boulevard Ct
- 1990 149th Ave
- 14886 Saturn Dr
- 14840 Boulevard Ct