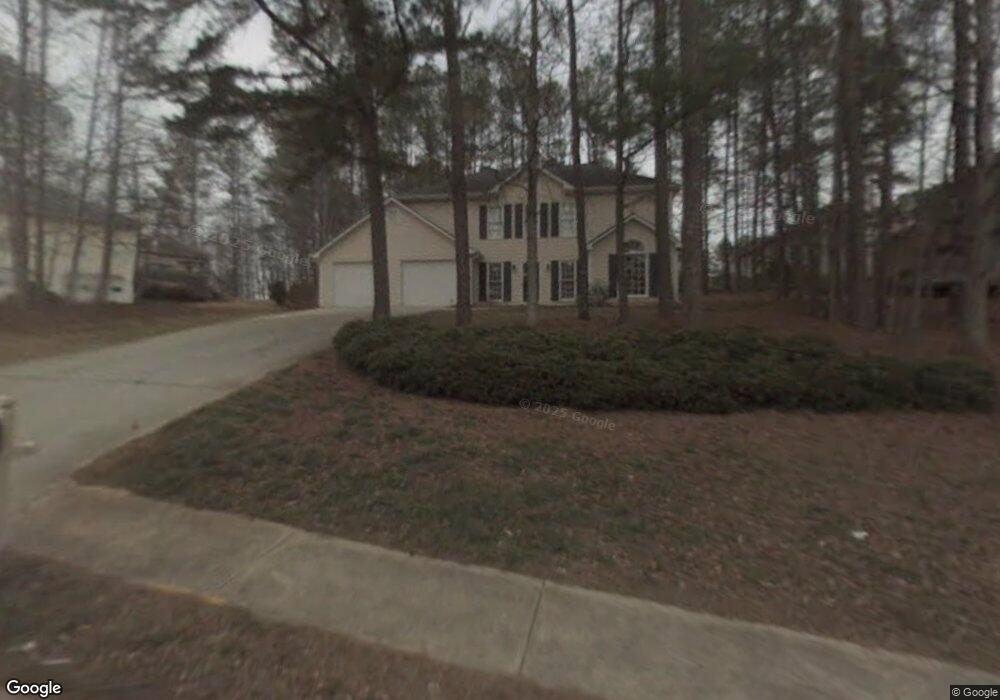
1489 Mill Creek Ct SW Marietta, GA 30008
Southwestern Marietta NeighborhoodEstimated Value: $371,000 - $408,000
3
Beds
3
Baths
1,792
Sq Ft
$216/Sq Ft
Est. Value
About This Home
This home is located at 1489 Mill Creek Ct SW, Marietta, GA 30008 and is currently estimated at $386,733, approximately $215 per square foot. 1489 Mill Creek Ct SW is a home located in Cobb County with nearby schools including Birney Elementary School, Smitha Middle School, and Osborne High School.
Ownership History
Date
Name
Owned For
Owner Type
Purchase Details
Closed on
Nov 27, 2017
Sold by
Sandres Maritza
Bought by
Pineda Jonathan
Current Estimated Value
Home Financials for this Owner
Home Financials are based on the most recent Mortgage that was taken out on this home.
Original Mortgage
$207,668
Outstanding Balance
$176,917
Interest Rate
4.5%
Mortgage Type
FHA
Estimated Equity
$209,816
Purchase Details
Closed on
Jan 30, 2004
Sold by
Piroli Jessica D
Bought by
Sandres Maritza
Home Financials for this Owner
Home Financials are based on the most recent Mortgage that was taken out on this home.
Original Mortgage
$160,000
Interest Rate
5.77%
Mortgage Type
New Conventional
Purchase Details
Closed on
Jan 31, 2002
Sold by
Compton Beverly A
Bought by
Piroli Jessica D
Home Financials for this Owner
Home Financials are based on the most recent Mortgage that was taken out on this home.
Original Mortgage
$142,405
Interest Rate
7.16%
Mortgage Type
New Conventional
Create a Home Valuation Report for This Property
The Home Valuation Report is an in-depth analysis detailing your home's value as well as a comparison with similar homes in the area
Home Values in the Area
Average Home Value in this Area
Purchase History
| Date | Buyer | Sale Price | Title Company |
|---|---|---|---|
| Pineda Jonathan | $211,500 | -- | |
| Sandres Maritza | $160,000 | -- | |
| Piroli Jessica D | $149,900 | -- |
Source: Public Records
Mortgage History
| Date | Status | Borrower | Loan Amount |
|---|---|---|---|
| Open | Pineda Jonathan | $207,668 | |
| Previous Owner | Sandres Maritza | $160,000 | |
| Previous Owner | Piroli Jessica D | $142,405 |
Source: Public Records
Tax History Compared to Growth
Tax History
| Year | Tax Paid | Tax Assessment Tax Assessment Total Assessment is a certain percentage of the fair market value that is determined by local assessors to be the total taxable value of land and additions on the property. | Land | Improvement |
|---|---|---|---|---|
| 2025 | $4,520 | $150,016 | $35,200 | $114,816 |
| 2024 | $4,523 | $150,016 | $35,200 | $114,816 |
| 2023 | $4,244 | $140,752 | $10,000 | $130,752 |
| 2022 | $3,443 | $113,428 | $10,000 | $103,428 |
| 2021 | $2,992 | $98,580 | $10,000 | $88,580 |
| 2020 | $2,668 | $87,892 | $10,000 | $77,892 |
| 2019 | $2,343 | $77,204 | $10,000 | $67,204 |
| 2018 | $2,343 | $77,204 | $10,000 | $67,204 |
| 2017 | $1,302 | $54,208 | $10,000 | $44,208 |
| 2016 | $1,303 | $54,208 | $10,000 | $44,208 |
| 2015 | $1,329 | $53,940 | $8,000 | $45,940 |
| 2014 | $1,340 | $53,940 | $0 | $0 |
Source: Public Records
Map
Nearby Homes
- 3075 Milford Chase SW
- 3123 Milford Chase SW
- 1427 Lost Bridge Rd
- 1308 Willamette Way
- 2964 Edgemont Ln SW
- 1345 Windage Ct SW Unit 6
- 1086 Mornington Way
- 3004 Michael Dr SW
- 3055 Milford Chase Overlook SW
- 1108 Byers Dr SW
- 2615 Windage Dr SW
- 2907 Crest Ridge Ct SW
- 2700 Flintlock Ln SW
- 1559 Woodmore Dr SW
- 1719 Silverchase Dr SW
- 1104 Havel Dr SW
- 3340 Vineland Dr SW
- 2867 Creek Ct SW
- 3096 Milford Chase SW
- 3094 Milford Chase SW Unit 140
- 3094 Milford Chase SW
- 2865 Creek Ct SW Unit 2
- 1490 Mill Creek Ct SW
- 3092 Milford Chase SW
- 3098R Milford Chase
- 3098 Milford Chase SW
- 1491 Mill Creek Ct SW
- 2863 Creek Ct SW
- 3093 Milford Chase SW Unit 2
- 3090 Milford Chase SW
- 1492 Mill Creek Ct SW Unit 2
- 3090 Milford Ct SW
- 3095 Milford Chase SW
- 2861 Creek Ct SW Unit 2
- 3082 Milford Chase SW
- 0 Creek Ct SW Unit 8918809
- 0 Creek Ct SW