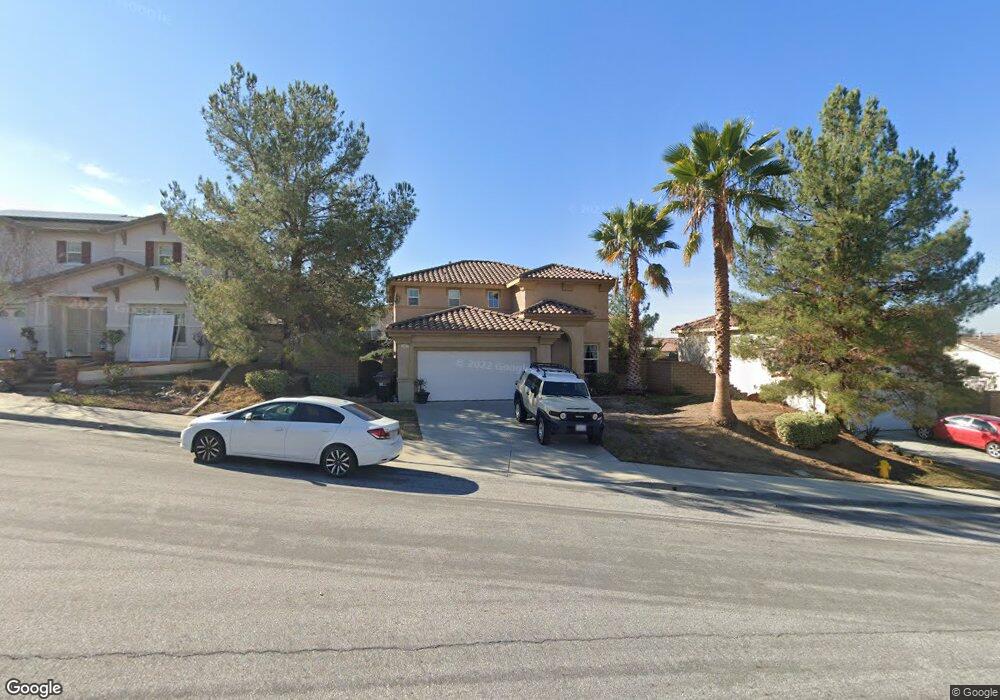
14891 Norfolk Cir Moreno Valley, CA 92555
Rancho Belago NeighborhoodEstimated Value: $553,898 - $585,000
3
Beds
3
Baths
2,251
Sq Ft
$252/Sq Ft
Est. Value
About This Home
This home is located at 14891 Norfolk Cir, Moreno Valley, CA 92555 and is currently estimated at $567,725, approximately $252 per square foot. 14891 Norfolk Cir is a home located in Riverside County with nearby schools including Ridge Crest Elementary School, Landmark Middle, and Vista Del Lago High School.
Ownership History
Date
Name
Owned For
Owner Type
Purchase Details
Closed on
Jul 26, 2011
Sold by
Malekzadeh Sean A and Malekzadeh Soheila H
Bought by
Malekzadeh Shapour
Current Estimated Value
Home Financials for this Owner
Home Financials are based on the most recent Mortgage that was taken out on this home.
Original Mortgage
$177,598
Outstanding Balance
$120,003
Interest Rate
4.06%
Mortgage Type
Seller Take Back
Estimated Equity
$447,722
Purchase Details
Closed on
Nov 30, 2009
Sold by
U S Bank National Association
Bought by
Malekzadeh Sean A and Malekzadeh Soheila H
Purchase Details
Closed on
Aug 20, 2009
Sold by
Kellier Elaine
Bought by
U S Bank National Association
Purchase Details
Closed on
Apr 28, 2004
Sold by
Kb Home Greater Los Angeles Inc
Bought by
Kellier Elaine
Home Financials for this Owner
Home Financials are based on the most recent Mortgage that was taken out on this home.
Original Mortgage
$255,851
Interest Rate
6.15%
Mortgage Type
Purchase Money Mortgage
Create a Home Valuation Report for This Property
The Home Valuation Report is an in-depth analysis detailing your home's value as well as a comparison with similar homes in the area
Home Values in the Area
Average Home Value in this Area
Purchase History
| Date | Buyer | Sale Price | Title Company |
|---|---|---|---|
| Malekzadeh Shapour | $175,000 | Orange Coast Title Co | |
| Malekzadeh Sean A | $180,000 | Chicago | |
| U S Bank National Association | $148,750 | Servicelink | |
| Kellier Elaine | $320,000 | First American Title Co |
Source: Public Records
Mortgage History
| Date | Status | Borrower | Loan Amount |
|---|---|---|---|
| Open | Malekzadeh Shapour | $177,598 | |
| Previous Owner | Kellier Elaine | $255,851 | |
| Closed | Kellier Elaine | $63,962 |
Source: Public Records
Tax History Compared to Growth
Tax History
| Year | Tax Paid | Tax Assessment Tax Assessment Total Assessment is a certain percentage of the fair market value that is determined by local assessors to be the total taxable value of land and additions on the property. | Land | Improvement |
|---|---|---|---|---|
| 2025 | $2,958 | $219,796 | $56,516 | $163,280 |
| 2023 | $2,958 | $211,263 | $54,322 | $156,941 |
| 2022 | $2,820 | $207,121 | $53,257 | $153,864 |
| 2021 | $2,768 | $203,061 | $52,213 | $150,848 |
| 2020 | $2,732 | $200,980 | $51,678 | $149,302 |
| 2019 | $2,693 | $197,040 | $50,665 | $146,375 |
| 2018 | $2,640 | $193,177 | $49,672 | $143,505 |
| 2017 | $2,580 | $189,391 | $48,699 | $140,692 |
| 2016 | $2,551 | $185,679 | $47,745 | $137,934 |
| 2015 | $2,515 | $182,892 | $47,029 | $135,863 |
| 2014 | $2,362 | $179,310 | $46,108 | $133,202 |
Source: Public Records
Map
Nearby Homes
- 14716 Grandview Dr
- 28837 Big Pine Way
- 14808 San Jacinto Dr
- 28320 Grandview Dr
- 28913 Avalon Ave
- 14921 Pete Dye St
- 28582 Buttercup Way
- 14925 Stephenson St
- 28140 Belleterre Ave
- 27964 John F. Kennedy Dr
- 28920 Kimberly Ave
- 27943 Cactus Ave Unit A
- 28915 Alessandro Blvd
- 27757 Rockwood Ave
- 14614 Newburgh Rd
- 27753 Lafayette Way
- 28196 Alessandro Blvd
- 15190 Legendary Dr
- 27597 Lafayette Way
- 29233 Stevens Ave
- 14881 Norfolk Cir
- 14901 Norfolk Cir
- 14890 Ryder Way
- 14880 Ryder Way
- 14871 Norfolk Cir
- 14900 Ryder Way
- 14870 Ryder Way
- 14888 Norfolk Cir
- 14910 Ryder Way
- 14898 Norfolk Cir
- 14861 Norfolk Cir
- 14908 Norfolk Cir
- 14860 Ryder Way
- 14920 Ryder Way
- 14893 Ryder Way
- 14879 Province Cir
- 14858 Norfolk Cir
- 14851 Norfolk Cir
- 14875 Ryder Way
- 14871 Province Cir