14895 Llagas Ave San Martin, CA 95046
Estimated Value: $1,322,000 - $1,489,000
4
Beds
2
Baths
1,880
Sq Ft
$753/Sq Ft
Est. Value
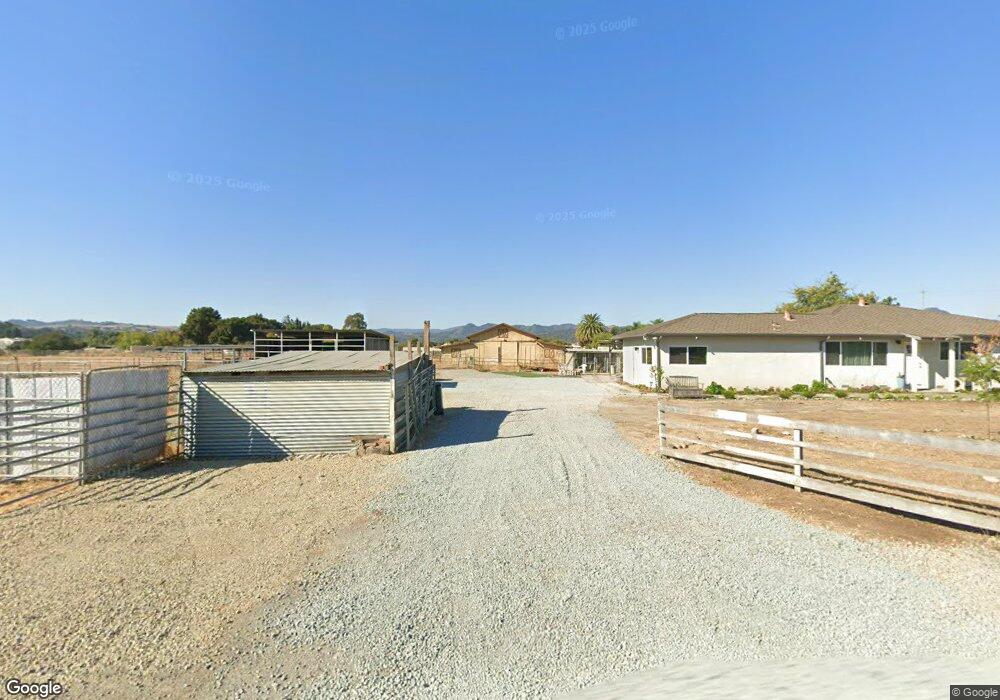
About This Home
This home is located at 14895 Llagas Ave, San Martin, CA 95046 and is currently estimated at $1,415,795, approximately $753 per square foot. 14895 Llagas Ave is a home located in Santa Clara County with nearby schools including San Martin/Gwinn Environmental Science Academy, Britton Middle School, and Ann Sobrato High School.
Ownership History
Date
Name
Owned For
Owner Type
Purchase Details
Closed on
Dec 26, 2024
Sold by
Fantum Holdings Llc
Bought by
Fan Jordan M
Current Estimated Value
Home Financials for this Owner
Home Financials are based on the most recent Mortgage that was taken out on this home.
Original Mortgage
$825,000
Outstanding Balance
$819,271
Interest Rate
6.81%
Mortgage Type
New Conventional
Estimated Equity
$596,524
Purchase Details
Closed on
Feb 22, 2023
Sold by
Stambaugh-Vargas Linda Nora
Bought by
Fantum Holdings Llc
Home Financials for this Owner
Home Financials are based on the most recent Mortgage that was taken out on this home.
Original Mortgage
$874,955
Interest Rate
6.13%
Mortgage Type
New Conventional
Create a Home Valuation Report for This Property
The Home Valuation Report is an in-depth analysis detailing your home's value as well as a comparison with similar homes in the area
Home Values in the Area
Average Home Value in this Area
Purchase History
| Date | Buyer | Sale Price | Title Company |
|---|---|---|---|
| Fan Jordan M | $1,445,000 | Commonwealth Land Title | |
| Fan Jordan M | $1,445,000 | Commonwealth Land Title | |
| Fantum Holdings Llc | $900,000 | Chicago Title |
Source: Public Records
Mortgage History
| Date | Status | Borrower | Loan Amount |
|---|---|---|---|
| Open | Fan Jordan M | $825,000 | |
| Closed | Fan Jordan M | $825,000 | |
| Previous Owner | Fantum Holdings Llc | $874,955 |
Source: Public Records
Tax History Compared to Growth
Tax History
| Year | Tax Paid | Tax Assessment Tax Assessment Total Assessment is a certain percentage of the fair market value that is determined by local assessors to be the total taxable value of land and additions on the property. | Land | Improvement |
|---|---|---|---|---|
| 2025 | $14,030 | $1,248,480 | $1,040,400 | $208,080 |
| 2024 | $14,030 | $1,224,000 | $1,020,000 | $204,000 |
| 2023 | $12,711 | $1,100,000 | $915,000 | $185,000 |
| 2022 | $3,713 | $316,210 | $175,695 | $140,515 |
| 2021 | $3,619 | $310,010 | $172,250 | $137,760 |
| 2020 | $3,532 | $306,832 | $170,484 | $136,348 |
| 2019 | $3,627 | $300,817 | $167,142 | $133,675 |
| 2018 | $3,635 | $294,919 | $163,865 | $131,054 |
| 2017 | $3,598 | $289,137 | $160,652 | $128,485 |
| 2016 | $3,367 | $283,468 | $157,502 | $125,966 |
| 2015 | $3,329 | $279,211 | $155,137 | $124,074 |
| 2014 | $3,358 | $273,743 | $152,099 | $121,644 |
Source: Public Records
Map
Nearby Homes
- 0 Seymour Ave Unit 225017465
- 475 E Middle Ave
- 14430 Monterey Hwy
- 14325 Monterey Rd
- 15465 Leann Ct
- 14205 Sycamore Ave
- 0 Tennant Ave
- 0 Llagas Ave Unit ML82019140
- 13690 Murphy Ave #E
- 952 Blaise Ln Unit 1001
- 952 Blaise Ln
- 967 Bosco Ln Unit 1505
- 964 Blaise Ln Unit 1004
- 922 Loyola Ln
- 14515 Shadowlane Ct
- 542 Via Sorrento
- 42 Dewey Cir
- 13755 Columbet Ave
- 92 Melody Ln Unit 92
- 13705 Sycamore Ave
- 14955 Llagas Ave
- 14880 Llagas Ave
- 14995 Llagas Ave
- 15080 Llagas Ave
- 14950 Lopez Ct
- 14830 Llagas Ave
- 14870 Seymour Ave
- 15010 Lopez Ct
- 15050 Lopez Ct
- 14714 Seymour Ave
- 14800 Llagas Ave
- 14830 Seymour Ave
- 14710 Llagas Ave
- 15100 Llagas Ave
- 14695 Llagas Ave
- 1880 Seymour Ave
- 14680 Llagas Ave
- 0 Seymour Ave Unit ML81704550
- 0 Seymour Ave Unit ML80835834
- 0 Seymour Ave Unit ML81320636