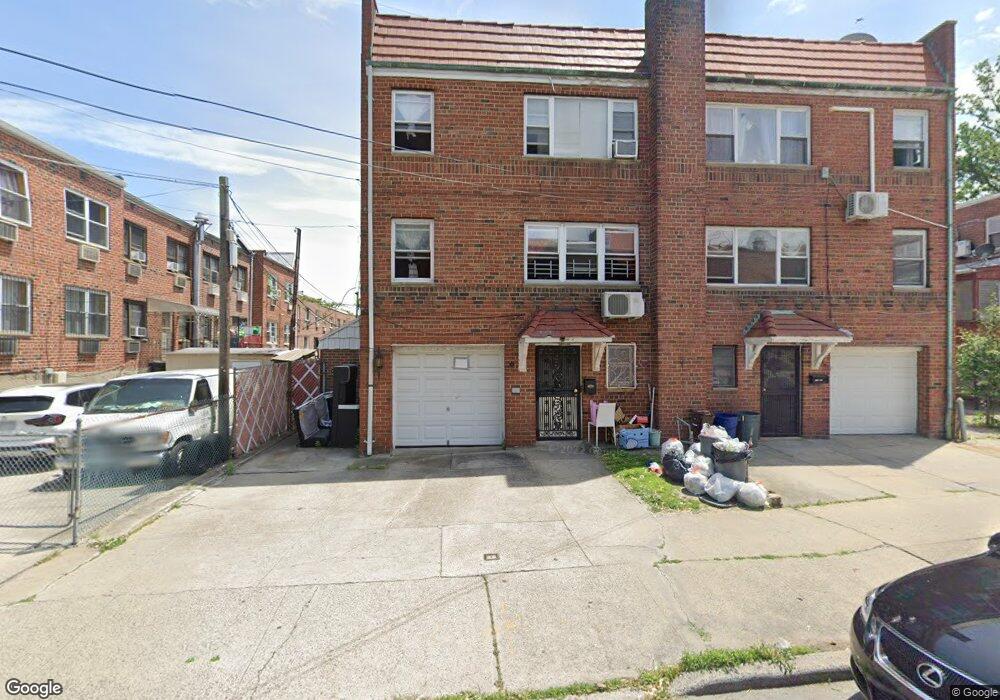
149-12 38th Ave Unit 2FL Flushing, NY 11354
Flushing NeighborhoodEstimated Value: $1,508,231 - $1,789,000
3
Beds
1
Bath
2,902
Sq Ft
$569/Sq Ft
Est. Value
About This Home
This home is located at 149-12 38th Ave Unit 2FL, Flushing, NY 11354 and is currently estimated at $1,651,558, approximately $569 per square foot. 149-12 38th Ave Unit 2FL is a home located in Queens County with nearby schools including P.S. 32 - State Street, J.H.S. 189Q Daniel Carter Beard, and Flushing High School.
Ownership History
Date
Name
Owned For
Owner Type
Purchase Details
Closed on
Mar 13, 2024
Sold by
Li Shi Ping and Zhuo Zheng Bao
Bought by
Guo Hua Zhuo As Trustee and Zheng Bao Zhuo And Shi Ping Li Irrev Tru
Current Estimated Value
Purchase Details
Closed on
Dec 8, 2008
Sold by
Dai Mei Li
Bought by
Li Shi Ping and Zhuo Zheng Bao
Home Financials for this Owner
Home Financials are based on the most recent Mortgage that was taken out on this home.
Original Mortgage
$530,000
Interest Rate
6.27%
Mortgage Type
Purchase Money Mortgage
Purchase Details
Closed on
Oct 24, 2005
Sold by
Dai Chen Chun and Dai Yu
Bought by
Dai Mei Li
Purchase Details
Closed on
Jul 17, 2000
Sold by
Wang Yan Z and Dai Mei Li
Bought by
Dai Yu and Dai Chen Chun
Purchase Details
Closed on
Apr 12, 2000
Sold by
Yu Dai and Ching Dai Kuo
Bought by
Wang Yan Z and Dai Mei Li
Create a Home Valuation Report for This Property
The Home Valuation Report is an in-depth analysis detailing your home's value as well as a comparison with similar homes in the area
Home Values in the Area
Average Home Value in this Area
Purchase History
| Date | Buyer | Sale Price | Title Company |
|---|---|---|---|
| Guo Hua Zhuo As Trustee | -- | -- | |
| Guo Hua Zhuo As Trustee | -- | -- | |
| Guo Hua Zhuo As Trustee | -- | -- | |
| Li Shi Ping | $856,000 | -- | |
| Li Shi Ping | $856,000 | -- | |
| Dai Mei Li | -- | -- | |
| Dai Mei Li | -- | -- | |
| Dai Yu | -- | -- | |
| Dai Yu | -- | -- | |
| Wang Yan Z | $40,000 | -- | |
| Wang Yan Z | -- | -- |
Source: Public Records
Mortgage History
| Date | Status | Borrower | Loan Amount |
|---|---|---|---|
| Previous Owner | Li Shi Ping | $530,000 |
Source: Public Records
Tax History
| Year | Tax Paid | Tax Assessment Tax Assessment Total Assessment is a certain percentage of the fair market value that is determined by local assessors to be the total taxable value of land and additions on the property. | Land | Improvement |
|---|---|---|---|---|
| 2025 | $11,795 | $61,908 | $15,015 | $46,893 |
| 2024 | $11,795 | $58,723 | $14,252 | $44,471 |
| 2023 | $11,354 | $56,532 | $12,709 | $43,823 |
| 2022 | $11,285 | $81,360 | $21,960 | $59,400 |
| 2021 | $11,508 | $87,000 | $21,960 | $65,040 |
| 2020 | $10,920 | $78,900 | $21,960 | $56,940 |
| 2019 | $10,237 | $83,040 | $21,960 | $61,080 |
| 2018 | $9,603 | $47,110 | $12,791 | $34,319 |
| 2017 | $9,603 | $47,110 | $14,624 | $32,486 |
| 2016 | $9,110 | $47,110 | $14,624 | $32,486 |
| 2015 | $5,141 | $42,992 | $18,654 | $24,338 |
| 2014 | $5,141 | $40,780 | $19,712 | $21,068 |
Source: Public Records
Map
Nearby Homes
- 38-15 149th St Unit 1S
- 38-15 149th St Unit 3V
- 38-15 149th St Unit 5H
- 38-15 149th St Unit 6M
- 38-15 149th St Unit 1A
- 38-15 149th St Unit 3C
- 147-37 Roosevelt Ave Unit 2C
- 37-10 149th Place Unit 3A
- 147-37 38th Ave Unit C64
- 147-37 38th Ave Unit C23
- 147-37 38th Ave Unit C66
- 14737 38th Ave Unit C54
- 14737 38th Ave Unit C48
- 147- 25 38th Ave Unit F26
- 147-31 38th Ave Unit A68
- 150-02 Northern Blvd Unit 3C
- 150-02 Northern Blvd Unit 6H
- 150-02 Northern Blvd Unit 6E
- 150-02 Northern Blvd Unit 6A
- 150-02 Northern Blvd Unit 3L
- 14912 38th Ave
- 14910 38th Ave
- 38-01 149th St
- 3804 149th Place
- 3808 149th Place
- 38-10 149th Place
- 3802 149th Place
- 3801 149th St
- 3810 149th Place
- 3803 149th St
- 3803 149th St Unit 2 FL
- 3803 149th St Unit 3 FL
- 3803 149th St
- 3803 149th St
- 3812 149th Place
- 3814 149th Place
- 3731 149 St Unit 2L
- 38-04 149th Place
- 3816 149th Place
- 38-16 149th Place Unit 2 or 3
Your Personal Tour Guide
Ask me questions while you tour the home.