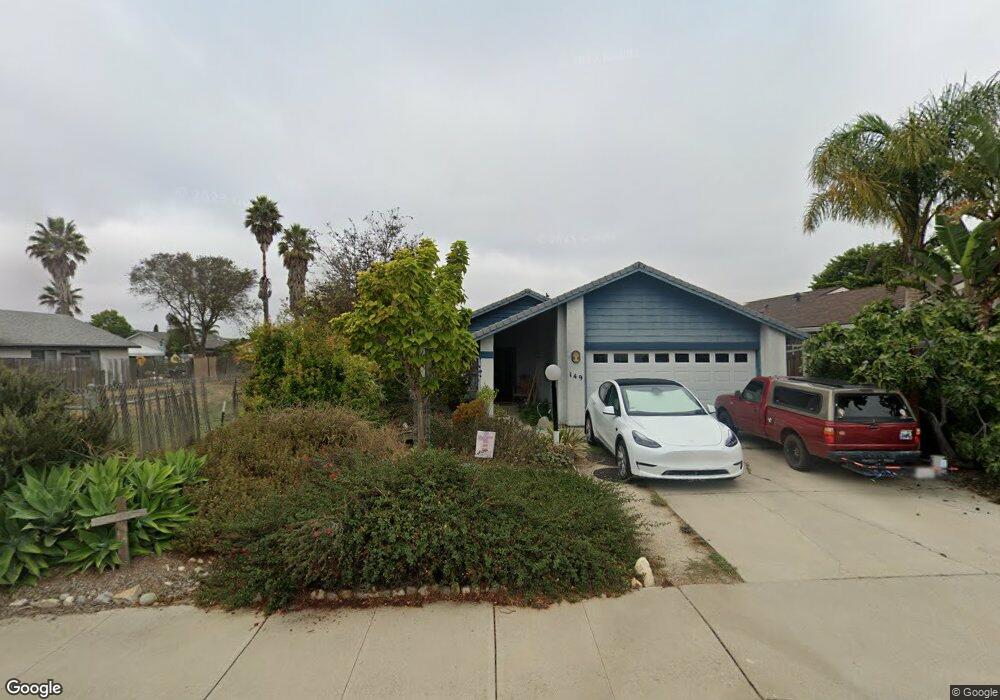
149 E Knotts St Nipomo, CA 93444
Estimated Value: $580,000 - $688,000
3
Beds
2
Baths
1,200
Sq Ft
$527/Sq Ft
Est. Value
About This Home
This home is located at 149 E Knotts St, Nipomo, CA 93444 and is currently estimated at $632,507, approximately $527 per square foot. 149 E Knotts St is a home located in San Luis Obispo County with nearby schools including Nipomo Elementary School, Mesa Middle School, and Nipomo High School.
Ownership History
Date
Name
Owned For
Owner Type
Purchase Details
Closed on
Dec 7, 2020
Sold by
Sever Elizabeth Ann and Sever Frank
Bought by
Sever Frank and Sever Elizabeth Ann
Current Estimated Value
Purchase Details
Closed on
Jan 9, 2015
Sold by
Sever Frank and Sever Elizabeth Ann
Bought by
Sever Elizabeth Ann and Sever Frank
Home Financials for this Owner
Home Financials are based on the most recent Mortgage that was taken out on this home.
Original Mortgage
$140,000
Outstanding Balance
$48,954
Interest Rate
3.82%
Mortgage Type
New Conventional
Estimated Equity
$583,553
Purchase Details
Closed on
Feb 17, 2010
Sold by
Department Of Veterans Affairs Of The St
Bought by
Sever Frank and Sever Elizabeth Ann
Home Financials for this Owner
Home Financials are based on the most recent Mortgage that was taken out on this home.
Original Mortgage
$149,000
Interest Rate
4.97%
Mortgage Type
New Conventional
Purchase Details
Closed on
Mar 14, 2000
Sold by
Miller Richard W and Miller Joyce D
Bought by
Va
Create a Home Valuation Report for This Property
The Home Valuation Report is an in-depth analysis detailing your home's value as well as a comparison with similar homes in the area
Home Values in the Area
Average Home Value in this Area
Purchase History
| Date | Buyer | Sale Price | Title Company |
|---|---|---|---|
| Sever Frank | -- | None Available | |
| Sever Elizabeth Ann | -- | Fidelity National Title | |
| Sever Frank | -- | First American Title Co | |
| Va | $162,000 | Cuesta Title Company |
Source: Public Records
Mortgage History
| Date | Status | Borrower | Loan Amount |
|---|---|---|---|
| Open | Sever Elizabeth Ann | $140,000 | |
| Closed | Sever Frank | $149,000 |
Source: Public Records
Tax History
| Year | Tax Paid | Tax Assessment Tax Assessment Total Assessment is a certain percentage of the fair market value that is determined by local assessors to be the total taxable value of land and additions on the property. | Land | Improvement |
|---|---|---|---|---|
| 2025 | $2,511 | $244,084 | $105,465 | $138,619 |
| 2024 | $2,482 | $239,299 | $103,398 | $135,901 |
| 2023 | $2,482 | $234,608 | $101,371 | $133,237 |
| 2022 | $2,444 | $230,009 | $99,384 | $130,625 |
| 2021 | $2,440 | $225,500 | $97,436 | $128,064 |
| 2020 | $2,412 | $223,188 | $96,437 | $126,751 |
| 2019 | $2,397 | $218,813 | $94,547 | $124,266 |
| 2018 | $2,369 | $214,524 | $92,694 | $121,830 |
| 2017 | $2,324 | $210,319 | $90,877 | $119,442 |
| 2016 | $2,192 | $206,196 | $89,096 | $117,100 |
| 2015 | $2,161 | $203,100 | $87,758 | $115,342 |
| 2014 | $2,081 | $199,122 | $86,039 | $113,083 |
Source: Public Records
Map
Nearby Homes
- 0 S Burton St
- 215 Rancho Rd
- 90111003 W Price St
- 189 E Tefft St
- 195 E Tefft St
- 192 E Branch St
- 285 E Tefft St
- 239 E Branch St
- 247 E Branch St
- 150 E Chestnut St
- 1 W Branch St
- 195 E Chestnut St
- 267 W Tefft St
- 136 Clearwater Ln
- 449 W Tefft St
- 449 W Tefft St Unit 23
- 449 W Tefft St Unit 22
- 449 W Tefft St Unit 13
- 571 S Oakglen Ave
- 567 S Oakglen Ave
- 137 E Knotts St
- 155 E Knotts St
- 148 E Vintage St Unit E
- 148 E Vintage St
- 136 E Vintage St
- 131 E Knotts St
- 154 E Vintage St
- 161 E Knotts St
- 130 E Vintage St
- 160 E Vintage St
- 167 E Knotts St
- 166 E Vintage St
- 129 E Knotts St
- 173 E Knotts St
- 172 E Vintage St
- 179 E Knotts St
- 125 E Knotts St
- 124 E Vintage St
- 178 E Vintage St
Your Personal Tour Guide
Ask me questions while you tour the home.