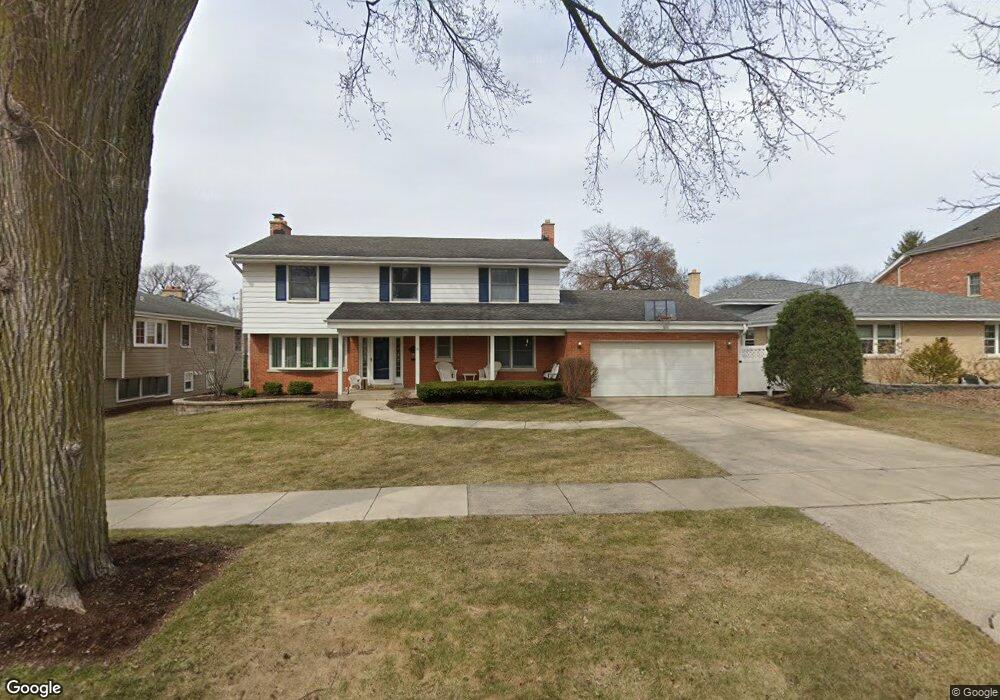
149 E Quincy St Elmhurst, IL 60126
Estimated Value: $903,000 - $939,000
--
Bed
--
Bath
2,680
Sq Ft
$344/Sq Ft
Est. Value
About This Home
This home is located at 149 E Quincy St, Elmhurst, IL 60126 and is currently estimated at $921,462, approximately $343 per square foot. 149 E Quincy St is a home located in DuPage County with nearby schools including Pulaski Intl School of Chicago, Revere Elementary School, and Jackson Elementary School.
Ownership History
Date
Name
Owned For
Owner Type
Purchase Details
Closed on
Jan 9, 2006
Sold by
Pankau Brett F and Pankau Kathryn J
Bought by
Gallagher John F and Gallagher Margaret M
Current Estimated Value
Home Financials for this Owner
Home Financials are based on the most recent Mortgage that was taken out on this home.
Original Mortgage
$350,000
Interest Rate
6.34%
Mortgage Type
Fannie Mae Freddie Mac
Create a Home Valuation Report for This Property
The Home Valuation Report is an in-depth analysis detailing your home's value as well as a comparison with similar homes in the area
Home Values in the Area
Average Home Value in this Area
Purchase History
| Date | Buyer | Sale Price | Title Company |
|---|---|---|---|
| Gallagher John F | $650,000 | Ctic |
Source: Public Records
Mortgage History
| Date | Status | Borrower | Loan Amount |
|---|---|---|---|
| Closed | Gallagher John F | $350,000 |
Source: Public Records
Tax History Compared to Growth
Tax History
| Year | Tax Paid | Tax Assessment Tax Assessment Total Assessment is a certain percentage of the fair market value that is determined by local assessors to be the total taxable value of land and additions on the property. | Land | Improvement |
|---|---|---|---|---|
| 2024 | $15,644 | $267,582 | $117,148 | $150,434 |
| 2023 | $14,536 | $247,440 | $108,330 | $139,110 |
| 2022 | $14,060 | $237,860 | $104,130 | $133,730 |
| 2021 | $13,714 | $231,940 | $101,540 | $130,400 |
| 2020 | $13,187 | $226,850 | $99,310 | $127,540 |
| 2019 | $12,916 | $215,680 | $94,420 | $121,260 |
| 2018 | $13,062 | $216,850 | $89,390 | $127,460 |
| 2017 | $12,784 | $206,640 | $85,180 | $121,460 |
| 2016 | $12,523 | $194,660 | $80,240 | $114,420 |
| 2015 | $12,411 | $181,350 | $74,750 | $106,600 |
| 2014 | $12,958 | $174,150 | $59,320 | $114,830 |
| 2013 | $12,816 | $176,610 | $60,160 | $116,450 |
Source: Public Records
Map
Nearby Homes
- 837 S Kearsage Ave
- 162 E Hale St
- 185 E Oneida Ave
- 694 S York St
- 900 S Colfax Ave
- 680 S Bryan St
- 341 E Madison St
- 100 W Butterfield Rd Unit 112N
- 936 S Mitchell Ave
- 353 E Butterfield Rd
- 274 E Crescent Ave
- 110 W Butterfield Rd Unit 502S
- 613 S Chatham Ave
- 1005 S Mitchell Ave
- 814 S Saylor Ave
- 580 S Kearsage Ave
- 991 S Swain Ave
- 995 S Swain Ave
- 762 S Saylor Ave
- 963 S Saylor Ave
- 155 E Quincy St
- 143 E Quincy St
- 161 E Quincy St
- 150 E Adams St
- 146 E Adams St
- 154 E Adams St
- 142 E Adams St
- 165 E Quincy St
- 158 E Adams St
- 831 S Kent Ave
- 133 E Quincy St
- 148 E Quincy St
- 152 E Quincy St
- 827 S Kent Ave
- 156 E Quincy St
- 823 S Kent Ave
- 134 E Quincy St
- 824 S York St
- 134 E Adams St
- 162 E Quincy St