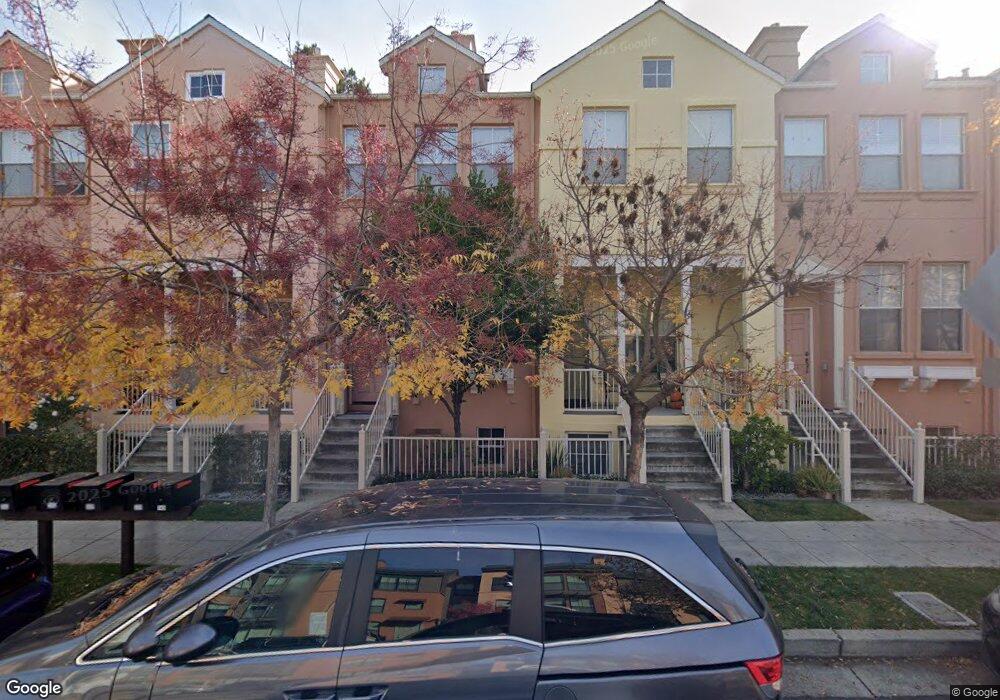
149 Pacchetti Way Mountain View, CA 94040
Mountain View West NeighborhoodEstimated Value: $1,207,000 - $1,601,000
3
Beds
3
Baths
1,421
Sq Ft
$978/Sq Ft
Est. Value
About This Home
This home is located at 149 Pacchetti Way, Mountain View, CA 94040 and is currently estimated at $1,390,187, approximately $978 per square foot. 149 Pacchetti Way is a home located in Santa Clara County with nearby schools including Covington Elementary School, Ardis G. Egan Junior High School, and Los Altos High School.
Ownership History
Date
Name
Owned For
Owner Type
Purchase Details
Closed on
Aug 22, 2024
Sold by
Peng Shing-Jen and Li Bey-Bey
Bought by
Li-Peng Family Trust and Peng
Current Estimated Value
Purchase Details
Closed on
Jan 21, 2003
Sold by
Douville Renee
Bought by
Peng Shing Jen and Li Bey Bey
Home Financials for this Owner
Home Financials are based on the most recent Mortgage that was taken out on this home.
Original Mortgage
$405,600
Interest Rate
5.62%
Mortgage Type
Purchase Money Mortgage
Purchase Details
Closed on
Apr 22, 1999
Sold by
Plymouth Mountain View Centre Lp
Bought by
Douville Renee
Home Financials for this Owner
Home Financials are based on the most recent Mortgage that was taken out on this home.
Original Mortgage
$335,992
Interest Rate
7.1%
Mortgage Type
Purchase Money Mortgage
Create a Home Valuation Report for This Property
The Home Valuation Report is an in-depth analysis detailing your home's value as well as a comparison with similar homes in the area
Home Values in the Area
Average Home Value in this Area
Purchase History
| Date | Buyer | Sale Price | Title Company |
|---|---|---|---|
| Li-Peng Family Trust | -- | None Listed On Document | |
| Peng Shing Jen | $507,000 | First American Title Company | |
| Douville Renee | $420,000 | Fidelity National Title Co |
Source: Public Records
Mortgage History
| Date | Status | Borrower | Loan Amount |
|---|---|---|---|
| Previous Owner | Peng Shing Jen | $405,600 | |
| Previous Owner | Douville Renee | $335,992 | |
| Closed | Douville Renee | $41,900 |
Source: Public Records
Tax History
| Year | Tax Paid | Tax Assessment Tax Assessment Total Assessment is a certain percentage of the fair market value that is determined by local assessors to be the total taxable value of land and additions on the property. | Land | Improvement |
|---|---|---|---|---|
| 2025 | $9,135 | $734,283 | $289,656 | $444,627 |
| 2024 | $9,135 | $719,886 | $283,977 | $435,909 |
| 2023 | $8,969 | $705,771 | $278,409 | $427,362 |
| 2022 | $8,903 | $691,933 | $272,950 | $418,983 |
| 2021 | $8,949 | $678,367 | $267,599 | $410,768 |
| 2020 | $9,020 | $671,413 | $264,856 | $406,557 |
| 2019 | $8,610 | $658,249 | $259,663 | $398,586 |
| 2018 | $8,533 | $645,343 | $254,572 | $390,771 |
| 2017 | $8,229 | $632,690 | $249,581 | $383,109 |
| 2016 | $8,019 | $620,286 | $244,688 | $375,598 |
| 2015 | $7,907 | $610,970 | $241,013 | $369,957 |
| 2014 | $7,827 | $599,003 | $236,292 | $362,711 |
Source: Public Records
Map
Nearby Homes
- 126 Pacchetti Way
- 131 Concord Cir
- 49 Showers Dr Unit A130
- 49 Showers Dr Unit N265
- 2483 Whitney Dr
- 400 Ortega Ave Unit 216
- 400 Ortega Ave Unit 313
- 400 Ortega Ave Unit 301
- 2235 Mora Place
- 2272 Towne Cir
- 426 Hillwood Ct Unit 303
- 164 Montelena Ct
- 2375 Adele Ave
- 70 Towne Cir
- 280 College Ave
- 3003 Marcelli Cir
- 889 N San Antonio Rd Unit 2020
- 37 Los Altos Square
- 444 San Antonio Rd Unit 1A
- 444 San Antonio Rd Unit 7A
- 147 Pacchetti Way
- 151 Pacchetti Way
- 145 Pacchetti Way
- 153 Pacchetti Way
- 155 Pacchetti Way
- 143 Pacchetti Way
- 157 Pacchetti Way
- 159 Pacchetti Way
- 143 Laurel Way
- 139 Laurel Way
- 161 Pacchetti Way
- 137 Laurel Way
- 163 Pacchetti Way
- 90 Freedom Ln
- 92 Freedom Ln
- 94 Freedom Ln
- 135 Laurel Way
- 96 Freedom Ln
- 141 Pacchetti Way
- 98 Freedom Ln
Your Personal Tour Guide
Ask me questions while you tour the home.