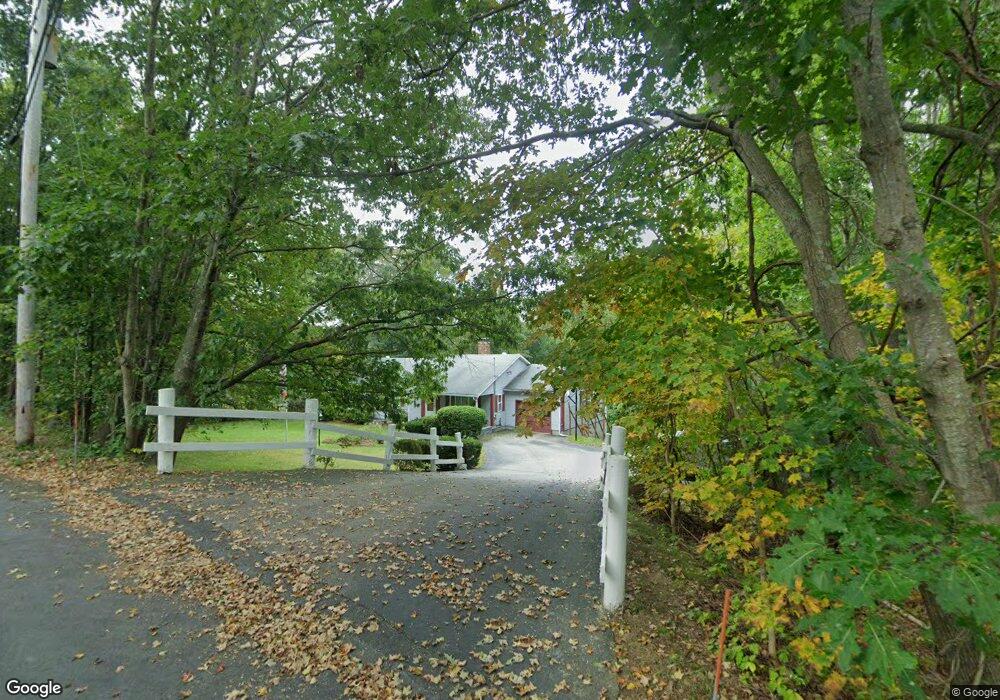
149 Sarty Rd West Brookfield, MA 01585
Estimated Value: $386,000 - $477,000
3
Beds
3
Baths
1,680
Sq Ft
$260/Sq Ft
Est. Value
About This Home
This home is located at 149 Sarty Rd, West Brookfield, MA 01585 and is currently estimated at $436,101, approximately $259 per square foot. 149 Sarty Rd is a home with nearby schools including Quaboag Regional High School.
Ownership History
Date
Name
Owned For
Owner Type
Purchase Details
Closed on
Jul 16, 1997
Sold by
Skekeur Linda A
Bought by
Grammo Timothy and Grammo Jane
Current Estimated Value
Home Financials for this Owner
Home Financials are based on the most recent Mortgage that was taken out on this home.
Original Mortgage
$89,000
Interest Rate
7.79%
Mortgage Type
Purchase Money Mortgage
Purchase Details
Closed on
May 11, 1994
Sold by
Stekeur Frank
Bought by
Stekeur Linda
Create a Home Valuation Report for This Property
The Home Valuation Report is an in-depth analysis detailing your home's value as well as a comparison with similar homes in the area
Home Values in the Area
Average Home Value in this Area
Purchase History
| Date | Buyer | Sale Price | Title Company |
|---|---|---|---|
| Grammo Timothy | $129,000 | -- | |
| Stekeur Linda | $1,000 | -- |
Source: Public Records
Mortgage History
| Date | Status | Borrower | Loan Amount |
|---|---|---|---|
| Open | Stekeur Linda | $74,800 | |
| Closed | Stekeur Linda | $89,000 |
Source: Public Records
Tax History Compared to Growth
Tax History
| Year | Tax Paid | Tax Assessment Tax Assessment Total Assessment is a certain percentage of the fair market value that is determined by local assessors to be the total taxable value of land and additions on the property. | Land | Improvement |
|---|---|---|---|---|
| 2025 | $5,022 | $339,100 | $68,800 | $270,300 |
| 2024 | $5,110 | $339,100 | $68,800 | $270,300 |
| 2023 | $5,261 | $333,000 | $68,800 | $264,200 |
| 2022 | $4,354 | $279,800 | $53,000 | $226,800 |
| 2021 | $4,263 | $267,100 | $50,100 | $217,000 |
| 2020 | $4,305 | $250,900 | $50,100 | $200,800 |
| 2019 | $4,307 | $237,300 | $50,000 | $187,300 |
| 2018 | $3,892 | $224,700 | $50,000 | $174,700 |
| 2017 | $3,890 | $209,600 | $51,900 | $157,700 |
| 2016 | $3,982 | $200,700 | $49,500 | $151,200 |
| 2015 | $3,703 | $197,500 | $49,500 | $148,000 |
| 2014 | $3,772 | $197,500 | $49,500 | $148,000 |
Source: Public Records
Map
Nearby Homes
- 1212 Southbridge Rd
- 18 Fox Run
- 366 Southbridge Rd
- 152 Southbridge Rd Unit 3D
- 29 Liberty St
- 124 Southbridge Rd
- Lot 8 Southbridge Rd
- LOT 7 Southbridge Rd
- 58 Nelson St
- 82 Comins Pond Rd
- Lot 4 Brimfield Rd
- 35 Bacon St
- 368 Keys Rd
- 72 Maple St
- 12 Presidential Cir
- 234 Wickaboag
- 91 W Main St
- 37 Central St
- 17 Otis St
- 71 W Main St