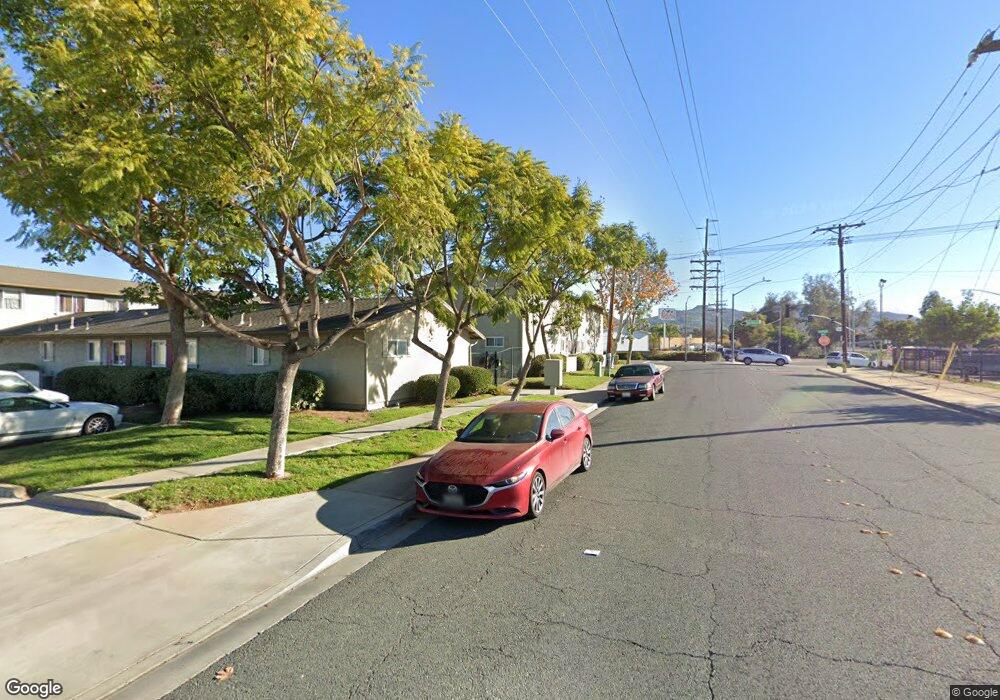
1490 Naranca Ave Unit 14 El Cajon, CA 92021
Estimated Value: $359,000 - $453,000
2
Beds
2
Baths
824
Sq Ft
$484/Sq Ft
Est. Value
About This Home
This home is located at 1490 Naranca Ave Unit 14, El Cajon, CA 92021 and is currently estimated at $398,515, approximately $483 per square foot. 1490 Naranca Ave Unit 14 is a home located in San Diego County with nearby schools including Madison Avenue Elementary School, Greenfield Middle School, and Granite Hills High School.
Ownership History
Date
Name
Owned For
Owner Type
Purchase Details
Closed on
Apr 25, 2017
Sold by
Felczer Breeann and Malaab Breeann
Bought by
Malaab Maher B and Malaab Breeann N
Current Estimated Value
Purchase Details
Closed on
Nov 1, 2011
Sold by
Fannie Mae
Bought by
Felczer Breeann
Home Financials for this Owner
Home Financials are based on the most recent Mortgage that was taken out on this home.
Original Mortgage
$105,730
Outstanding Balance
$72,237
Interest Rate
4.06%
Mortgage Type
New Conventional
Estimated Equity
$326,278
Purchase Details
Closed on
May 20, 2011
Sold by
Roberts Betsy and Roberts James
Bought by
Federal National Mortgage Association
Purchase Details
Closed on
May 29, 2007
Sold by
Naranca & Main Llc
Bought by
Roberts James and Roberts Betsy
Home Financials for this Owner
Home Financials are based on the most recent Mortgage that was taken out on this home.
Original Mortgage
$232,047
Interest Rate
6.5%
Mortgage Type
Unknown
Create a Home Valuation Report for This Property
The Home Valuation Report is an in-depth analysis detailing your home's value as well as a comparison with similar homes in the area
Home Values in the Area
Average Home Value in this Area
Purchase History
| Date | Buyer | Sale Price | Title Company |
|---|---|---|---|
| Malaab Maher B | -- | None Available | |
| Felczer Breeann | $109,000 | Lsi Title Company | |
| Federal National Mortgage Association | $258,670 | Accommodation | |
| Roberts James | $258,000 | Commonwealth Land Title Co |
Source: Public Records
Mortgage History
| Date | Status | Borrower | Loan Amount |
|---|---|---|---|
| Open | Felczer Breeann | $105,730 | |
| Previous Owner | Roberts James | $232,047 |
Source: Public Records
Tax History Compared to Growth
Tax History
| Year | Tax Paid | Tax Assessment Tax Assessment Total Assessment is a certain percentage of the fair market value that is determined by local assessors to be the total taxable value of land and additions on the property. | Land | Improvement |
|---|---|---|---|---|
| 2025 | $1,655 | $136,898 | $73,013 | $63,885 |
| 2024 | $1,655 | $134,215 | $71,582 | $62,633 |
| 2023 | $1,612 | $131,584 | $70,179 | $61,405 |
| 2022 | $1,587 | $129,004 | $68,803 | $60,201 |
| 2021 | $1,566 | $126,475 | $67,454 | $59,021 |
| 2020 | $1,549 | $125,179 | $66,763 | $58,416 |
| 2019 | $1,530 | $122,725 | $65,454 | $57,271 |
| 2018 | $1,506 | $120,320 | $64,171 | $56,149 |
| 2017 | $1,487 | $117,962 | $62,913 | $55,049 |
| 2016 | $1,428 | $115,650 | $61,680 | $53,970 |
| 2015 | $1,421 | $113,914 | $60,754 | $53,160 |
| 2014 | $1,394 | $111,683 | $59,564 | $52,119 |
Source: Public Records
Map
Nearby Homes
- 648 Trenton St Unit 5
- 1434 Peach Ave
- 1429 Oakdale Ave
- 907 Teatro Cir
- 1386-90 Oakdale Ave
- 603 Galena St
- 1425 E Madison Ave Unit 18
- 1425 E Madison Ave Unit 12
- 1386 E Madison Ave Unit 15
- 1507 Greenfield Dr
- 0 Marline Ave
- 222 Gull Place
- 1345 E Madison Ave Unit 5
- 1105 Bostonia St
- Plan 4 at Melodia
- Plan 2 at Melodia
- Plan 1 at Melodia
- Plan 3 at Melodia
- 1369 E Main St Unit 34
- 1369 E Main St Unit 3
- 1490 Naranca Ave Unit 3
- 1490 Naranca Ave Unit 2
- 1490 Naranca Ave Unit 1
- 1490 Naranca Ave Unit 13
- 1490 Naranca Ave Unit 12
- 1490 Naranca Ave Unit 11
- 1490 Naranca Ave Unit 10
- 1490 Naranca Ave Unit 9
- 1490 Naranca Ave Unit 8
- 1490 Naranca Ave Unit 7
- 1490 Naranca Ave Unit 6
- 1490 Naranca Ave Unit 5
- 1490 Naranca Ave Unit 4
- 1480 Naranca Ave Unit A-C
- 1480A Naranca Ave Unit C
- 748 N 3rd St
- 748A N 3rd St Unit Q
- 1476 Naranca Ave
- 776 N 3rd St
- 1483 Naranca Ave