Estimated Value: $250,000 - $264,000
4
Beds
4
Baths
1,664
Sq Ft
$153/Sq Ft
Est. Value
About This Home
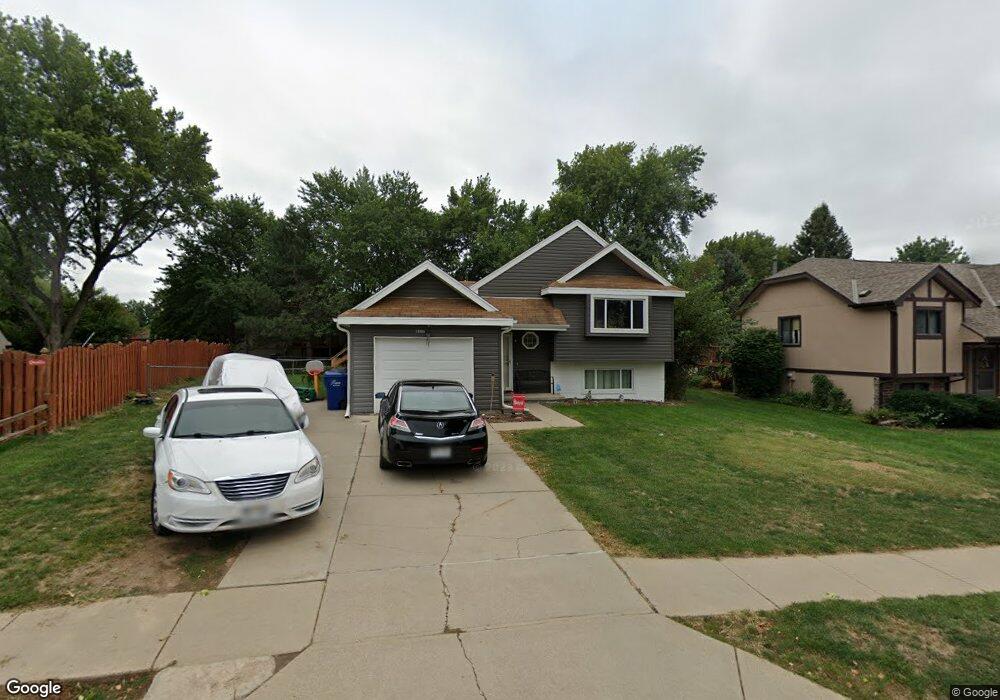
This home is located at 14905 Edna St, Omaha, NE 68138 and is currently estimated at $253,906, approximately $152 per square foot. 14905 Edna St is a home located in Sarpy County with nearby schools including Neihardt Elementary School, Millard South High School, and Harry Andersen Middle School.
Ownership History
Date
Name
Owned For
Owner Type
Purchase Details
Closed on
Nov 29, 2021
Sold by
Williams Sheri A
Bought by
Ek Real Estate Fund I Llc
Current Estimated Value
Home Financials for this Owner
Home Financials are based on the most recent Mortgage that was taken out on this home.
Original Mortgage
$150,000
Outstanding Balance
$137,924
Interest Rate
3.09%
Mortgage Type
New Conventional
Estimated Equity
$115,982
Purchase Details
Closed on
May 26, 2004
Sold by
Richardson Jayme L
Bought by
Williams Sheri A
Home Financials for this Owner
Home Financials are based on the most recent Mortgage that was taken out on this home.
Original Mortgage
$111,150
Interest Rate
8.12%
Purchase Details
Closed on
Mar 13, 2002
Sold by
Croy David L and Croy Tammi L
Bought by
Richardson Jayme L
Home Financials for this Owner
Home Financials are based on the most recent Mortgage that was taken out on this home.
Original Mortgage
$94,050
Interest Rate
7.5%
Create a Home Valuation Report for This Property
The Home Valuation Report is an in-depth analysis detailing your home's value as well as a comparison with similar homes in the area
Home Values in the Area
Average Home Value in this Area
Purchase History
| Date | Buyer | Sale Price | Title Company |
|---|---|---|---|
| Ek Real Estate Fund I Llc | $191,000 | New Title Company Name | |
| Williams Sheri A | $117,000 | Dri Title | |
| Richardson Jayme L | $99,000 | -- |
Source: Public Records
Mortgage History
| Date | Status | Borrower | Loan Amount |
|---|---|---|---|
| Open | Ek Real Estate Fund I Llc | $150,000 | |
| Previous Owner | Williams Sheri A | $111,150 | |
| Previous Owner | Richardson Jayme L | $94,050 |
Source: Public Records
Tax History Compared to Growth
Tax History
| Year | Tax Paid | Tax Assessment Tax Assessment Total Assessment is a certain percentage of the fair market value that is determined by local assessors to be the total taxable value of land and additions on the property. | Land | Improvement |
|---|---|---|---|---|
| 2025 | $2,900 | $233,353 | $38,000 | $195,353 |
| 2024 | $3,109 | $215,744 | $35,000 | $180,744 |
| 2023 | $3,109 | $187,258 | $29,000 | $158,258 |
| 2022 | $3,042 | $168,421 | $27,000 | $141,421 |
| 2021 | $2,935 | $160,144 | $25,000 | $135,144 |
| 2020 | $2,795 | $150,211 | $25,000 | $125,211 |
| 2019 | $2,614 | $139,703 | $25,000 | $114,703 |
| 2018 | $2,513 | $130,668 | $21,000 | $109,668 |
| 2017 | $2,334 | $123,321 | $21,000 | $102,321 |
| 2016 | $2,265 | $118,847 | $21,000 | $97,847 |
| 2015 | $2,295 | $119,611 | $21,000 | $98,611 |
| 2014 | $2,302 | $119,561 | $21,000 | $98,561 |
| 2012 | -- | $118,469 | $21,000 | $97,469 |
Source: Public Records
Map
Nearby Homes
- 14910 Edna St
- 14723 Borman St
- 14712 Gertrude St
- 14704 Josephine St
- 14704 Olive St
- 6523 S 150th St
- 7106 S 145th St
- 6734 S 152nd St
- 6735 S 153rd Cir
- 15010 Chandler Rd
- 14537 Drexel St
- 6906 S 153rd Cir
- 15219 Madison St
- 15141 Adams St
- 14533 Washington Cir
- 7110 S 141st St
- 6505 S 154th St
- 15303 Papio St
- 7214 S 140th Ave
- 15348 Chalco Pointe Dr