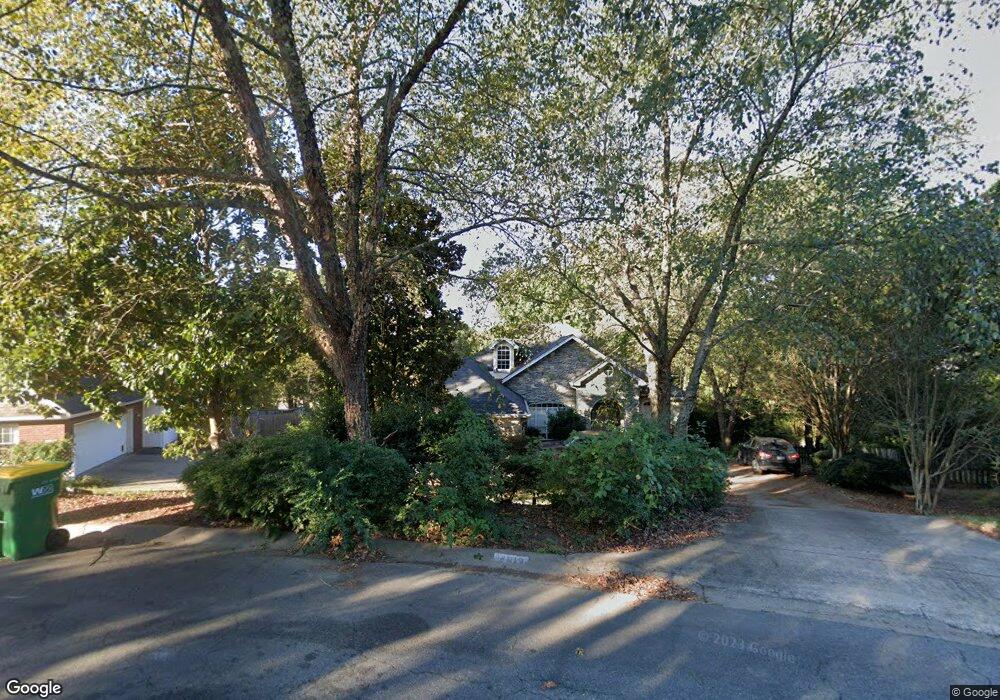
14919 Lamplight Way Little Rock, AR 72211
Rock Creek NeighborhoodEstimated Value: $402,813 - $417,000
4
Beds
3
Baths
2,950
Sq Ft
$138/Sq Ft
Est. Value
About This Home
This home is located at 14919 Lamplight Way, Little Rock, AR 72211 and is currently estimated at $408,453, approximately $138 per square foot. 14919 Lamplight Way is a home located in Pulaski County with nearby schools including Baker Interdistrict Elementary School, Joe T. Robinson Middle School, and Joe T. Robinson High School.
Ownership History
Date
Name
Owned For
Owner Type
Purchase Details
Closed on
May 17, 2011
Sold by
Pnc Bank National Association
Bought by
Allen Benjamin R and Allen Tara J
Current Estimated Value
Home Financials for this Owner
Home Financials are based on the most recent Mortgage that was taken out on this home.
Original Mortgage
$224,044
Interest Rate
4.25%
Mortgage Type
FHA
Purchase Details
Closed on
Jan 24, 2011
Sold by
Wells Fargo Bank Na
Bought by
Pnc Bank National Association
Purchase Details
Closed on
Nov 18, 2010
Sold by
Perrin Charles and Perrin Yuka
Bought by
Wells Fargo Bank Na
Purchase Details
Closed on
Mar 11, 2005
Sold by
Shollmier H Dudley
Bought by
Perrin Charles R
Home Financials for this Owner
Home Financials are based on the most recent Mortgage that was taken out on this home.
Original Mortgage
$59,300
Interest Rate
5.22%
Mortgage Type
Balloon
Create a Home Valuation Report for This Property
The Home Valuation Report is an in-depth analysis detailing your home's value as well as a comparison with similar homes in the area
Home Values in the Area
Average Home Value in this Area
Purchase History
| Date | Buyer | Sale Price | Title Company |
|---|---|---|---|
| Allen Benjamin R | $230,000 | None Available | |
| Pnc Bank National Association | -- | None Available | |
| Wells Fargo Bank Na | $227,793 | None Available | |
| Perrin Charles R | $297,000 | American Abstract & Title Co |
Source: Public Records
Mortgage History
| Date | Status | Borrower | Loan Amount |
|---|---|---|---|
| Previous Owner | Allen Benjamin R | $224,044 | |
| Previous Owner | Perrin Charles R | $59,300 | |
| Previous Owner | Perrin Charles R | $237,200 |
Source: Public Records
Tax History Compared to Growth
Tax History
| Year | Tax Paid | Tax Assessment Tax Assessment Total Assessment is a certain percentage of the fair market value that is determined by local assessors to be the total taxable value of land and additions on the property. | Land | Improvement |
|---|---|---|---|---|
| 2025 | $3,616 | $64,226 | $7,800 | $56,426 |
| 2024 | $3,315 | $64,226 | $7,800 | $56,426 |
| 2023 | $3,315 | $64,226 | $7,800 | $56,426 |
| 2022 | $3,164 | $64,226 | $7,800 | $56,426 |
| 2021 | $3,037 | $46,870 | $8,400 | $38,470 |
| 2020 | $2,639 | $46,870 | $8,400 | $38,470 |
| 2019 | $2,639 | $46,870 | $8,400 | $38,470 |
| 2018 | $2,664 | $46,870 | $8,400 | $38,470 |
| 2017 | $2,664 | $46,870 | $8,400 | $38,470 |
| 2016 | $3,551 | $60,670 | $12,000 | $48,670 |
| 2015 | $3,931 | $60,670 | $12,000 | $48,670 |
| 2014 | $3,931 | $60,670 | $12,000 | $48,670 |
Source: Public Records
Map
Nearby Homes
- 14904 Lamplight Way
- 400 Lasalle Dr
- 2106 Wellington Woods Dr
- 14710 Woodcreek Dr
- 410 Wellington Woods Loop
- 10 Palmetto Ct
- 44 Longwell Loop
- 36 Glasgow Ct
- 1606 Wetherborne Dr
- 14312 Pride Valley Dr
- 79 Saint Thomas Ct
- 14 Longwell Loop
- 75 Wellington Colony Dr
- 14905 Pride Valley Rd
- 3 Bonaparte Cir
- 60 Wellington Colony Dr
- 2001 Wellington Plantation Dr
- 1919 Wellington Village Rd
- 22 Jacob Place
- 728 Edgewood Cir
- 15001 Lamplight Way
- 14915 Lamplight Way
- 318 Parliament St
- 15003 Lamplight Way
- 322 Parliament St
- 314 Parliament St
- 14911 Lamplight Way
- 14916 Lamplight Way
- 402 Parliament St
- 15000 Lamplight Way
- 5 Parliament Place
- 15007 Lamplight Way
- 0 Lamplight Way
- 406 Parliament St
- 14909 Lamplight Way
- 14910 Lamplight Way
- 15004 Lamplight Way
- 410 Parliament St
- 7 Parliament Place
- 15011 Lamplight Way