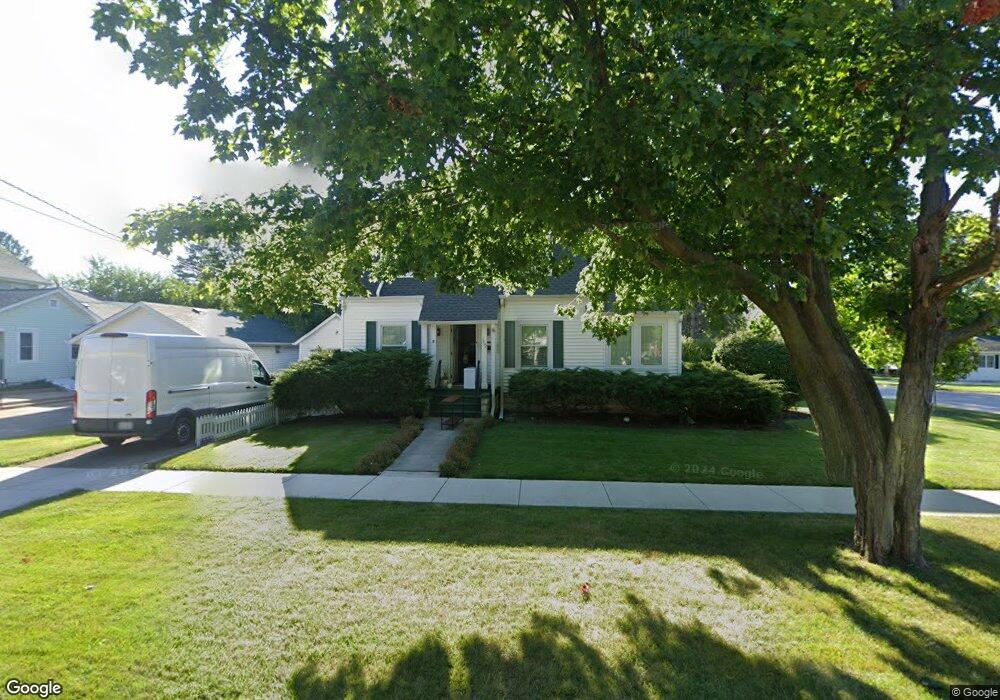
1492 S Jefferson St Lockport, IL 60441
South Lockport NeighborhoodEstimated Value: $241,000 - $341,603
--
Bed
1
Bath
--
Sq Ft
4,792
Sq Ft Lot
About This Home
This home is located at 1492 S Jefferson St, Lockport, IL 60441 and is currently estimated at $274,651. 1492 S Jefferson St is a home located in Will County with nearby schools including Taft Grade School, Lockport Township High School East, and Saint Dennis School.
Ownership History
Date
Name
Owned For
Owner Type
Purchase Details
Closed on
Jul 13, 2023
Sold by
Rutz Joshua Michael and Rutz Chelsea
Bought by
Malfeo Michelina Anna and Yozze Cameron Mark
Current Estimated Value
Home Financials for this Owner
Home Financials are based on the most recent Mortgage that was taken out on this home.
Original Mortgage
$248,000
Outstanding Balance
$241,906
Interest Rate
6.63%
Mortgage Type
New Conventional
Estimated Equity
$32,745
Purchase Details
Closed on
Oct 10, 2018
Sold by
New Home Llc
Bought by
Rutz Joshua Michael and Shankland Chelsea
Home Financials for this Owner
Home Financials are based on the most recent Mortgage that was taken out on this home.
Original Mortgage
$184,547
Interest Rate
4.5%
Mortgage Type
New Conventional
Purchase Details
Closed on
Jun 21, 2018
Sold by
Geuther Gregory K and The Raymond C Anderson Revocab
Bought by
Better Than New Homes Llc
Purchase Details
Closed on
Sep 7, 2017
Sold by
Anderson Raymond C
Bought by
Anderson Raymond C and The Raymond Chderson Revocable
Create a Home Valuation Report for This Property
The Home Valuation Report is an in-depth analysis detailing your home's value as well as a comparison with similar homes in the area
Home Values in the Area
Average Home Value in this Area
Purchase History
| Date | Buyer | Sale Price | Title Company |
|---|---|---|---|
| Malfeo Michelina Anna | $315,100 | Fidelity National Title | |
| Rutz Joshua Michael | $190,255 | Chicago Title | |
| Better Than New Homes Llc | $100,000 | First American Title Ins Co | |
| Anderson Raymond C | -- | None Available |
Source: Public Records
Mortgage History
| Date | Status | Borrower | Loan Amount |
|---|---|---|---|
| Open | Malfeo Michelina Anna | $248,000 | |
| Previous Owner | Rutz Joshua Michael | $184,547 |
Source: Public Records
Tax History Compared to Growth
Tax History
| Year | Tax Paid | Tax Assessment Tax Assessment Total Assessment is a certain percentage of the fair market value that is determined by local assessors to be the total taxable value of land and additions on the property. | Land | Improvement |
|---|---|---|---|---|
| 2024 | $4,678 | $58,224 | $16,833 | $41,391 |
| 2023 | $4,678 | $52,271 | $15,112 | $37,159 |
| 2022 | $3,518 | $46,401 | $13,415 | $32,986 |
| 2021 | $3,325 | $43,606 | $12,607 | $30,999 |
| 2020 | $3,237 | $42,172 | $12,192 | $29,980 |
| 2019 | $3,079 | $39,973 | $11,556 | $28,417 |
| 2018 | $3,132 | $44,779 | $10,897 | $33,882 |
| 2017 | $2,875 | $41,040 | $9,987 | $31,053 |
| 2016 | $2,494 | $36,424 | $8,864 | $27,560 |
| 2015 | $2,316 | $33,647 | $8,188 | $25,459 |
| 2014 | $2,316 | $32,987 | $8,027 | $24,960 |
| 2013 | $2,316 | $38,808 | $9,443 | $29,365 |
Source: Public Records
Map
Nearby Homes
- 1410 Lawrence Ave
- 1326 S Washington St
- 516 Whelan St
- 1623 East St
- 1513 Connor Ave
- 1111 S Lincoln St
- 200 E 11th St
- 1006 S Jefferson St
- 135 W 18th St
- 566 Mihelich Ln
- 2005 Princess Ct
- 2009 Princess Ct
- 2021 Princess Ct
- 206 Daggett Ave
- 536 Parkview Ln
- 1107 Garfield St
- 1935 S Hamilton St
- 1016 S State St
- 117 Daggett Ave
- 800 Madison St Unit 2C
- 1492 S Jefferson St
- 403 E Division St
- 411 E Division St
- 414 E 15th St
- 1502 S Jefferson St
- 1502 S Jefferson St Unit 1
- 313 E Division St
- 413 E Division St
- 1506 S Jefferson St
- 1501 S Jefferson St
- 421 E 15th St
- 415 E Division St
- 419 E 15th St
- 1512 S Jefferson St
- 1425 Lawrence Ave
- 1406 S Jefferson St
- 1427 Lawrence Ave
- 1511 S Jefferson St
- 327 E 15th St
- 321 E 14th St