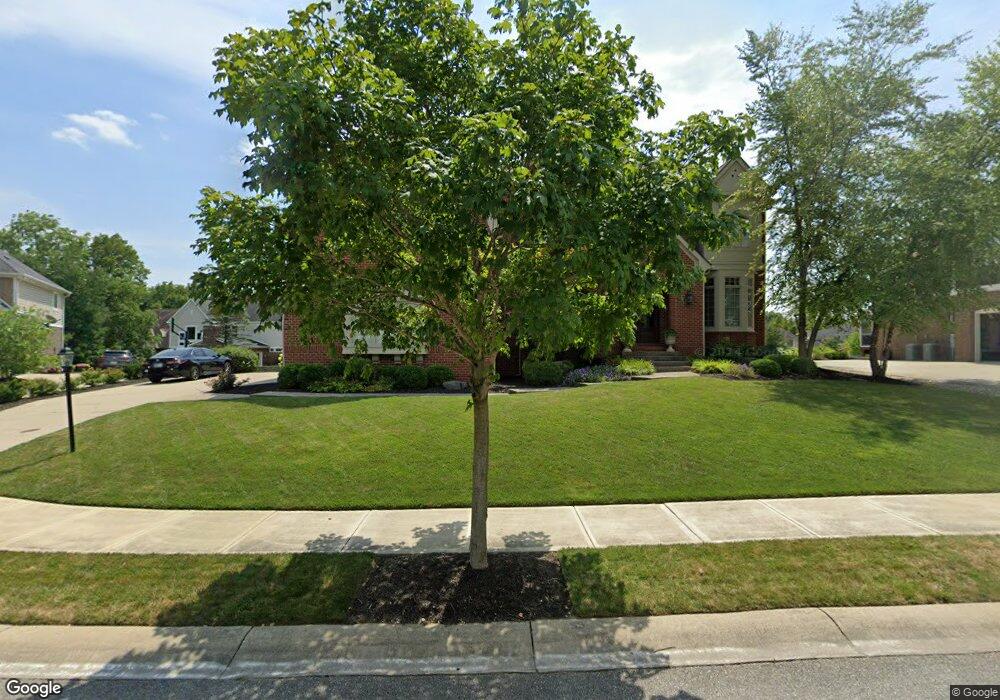
14925 Harvest Knoll Ct Fishers, IN 46037
Estimated Value: $685,000 - $1,145,000
5
Beds
5
Baths
5,544
Sq Ft
$174/Sq Ft
Est. Value
About This Home
This home is located at 14925 Harvest Knoll Ct, Fishers, IN 46037 and is currently estimated at $962,583, approximately $173 per square foot. 14925 Harvest Knoll Ct is a home located in Hamilton County with nearby schools including Thorpe Creek Elementary School, Hamilton Southeastern Intermediate / Junior High, and Hamilton Southeastern High School.
Ownership History
Date
Name
Owned For
Owner Type
Purchase Details
Closed on
Jun 10, 2010
Sold by
The Pinery Inc
Bought by
Cordell William C and Cordell Stacey S
Current Estimated Value
Home Financials for this Owner
Home Financials are based on the most recent Mortgage that was taken out on this home.
Original Mortgage
$400,000
Outstanding Balance
$253,633
Interest Rate
3.9%
Mortgage Type
New Conventional
Estimated Equity
$708,950
Purchase Details
Closed on
May 16, 2006
Sold by
Precedent Residential Development Llc
Bought by
Pinery Inc
Home Financials for this Owner
Home Financials are based on the most recent Mortgage that was taken out on this home.
Original Mortgage
$80,000
Interest Rate
6.62%
Mortgage Type
Purchase Money Mortgage
Create a Home Valuation Report for This Property
The Home Valuation Report is an in-depth analysis detailing your home's value as well as a comparison with similar homes in the area
Home Values in the Area
Average Home Value in this Area
Purchase History
| Date | Buyer | Sale Price | Title Company |
|---|---|---|---|
| Cordell William C | -- | Chicago Title Insurance Co | |
| Pinery Inc | -- | Chicago Title Fishers |
Source: Public Records
Mortgage History
| Date | Status | Borrower | Loan Amount |
|---|---|---|---|
| Open | Cordell William C | $400,000 | |
| Previous Owner | Pinery Inc | $80,000 |
Source: Public Records
Tax History Compared to Growth
Tax History
| Year | Tax Paid | Tax Assessment Tax Assessment Total Assessment is a certain percentage of the fair market value that is determined by local assessors to be the total taxable value of land and additions on the property. | Land | Improvement |
|---|---|---|---|---|
| 2024 | $9,007 | $765,200 | $198,900 | $566,300 |
| 2023 | $9,042 | $746,000 | $171,400 | $574,600 |
| 2022 | $8,850 | $710,700 | $155,800 | $554,900 |
| 2021 | $8,482 | $669,100 | $155,800 | $513,300 |
| 2020 | $8,585 | $674,600 | $155,800 | $518,800 |
| 2019 | $8,495 | $665,500 | $139,300 | $526,200 |
| 2018 | $8,585 | $671,000 | $139,300 | $531,700 |
| 2017 | $8,147 | $646,800 | $126,600 | $520,200 |
| 2016 | $8,050 | $638,900 | $126,600 | $512,300 |
| 2014 | $6,495 | $594,600 | $112,700 | $481,900 |
| 2013 | $6,495 | $599,700 | $112,700 | $487,000 |
Source: Public Records
Map
Nearby Homes
- 12630 Misty Ridge Ct
- 14682 Woodstone Cir
- 14745 Autumn View Way
- 12318 Whispering Breeze Dr
- 11991 Shady Knoll Dr
- 14514 Glapthorn Rd
- 11824 Sage Creek Bend
- 15412 Southeastern Pkwy
- 14598 Meadow Bend Dr
- 14584 Hinton Dr
- 14402 Wolverton Way
- 12004 Gatwick View Dr
- 14332 Eddington Place
- 14910 Garden Mist Place
- 14982 Garden Mist Place
- Camden Plan at The Cove - Designer Collection
- Maxwell Plan at The Cove - Designer Collection
- Wyatt Plan at The Cove - Designer Collection
- Pearson Plan at The Cove - Masterpiece Collection
- Ivy Plan at The Cove - Designer Collection
- 14907 Harvest Knoll Ct
- 14943 Harvest Knoll Ct
- 14940 Silent Bluff Ct
- 14889 Harvest Knoll Ct
- 14924 Harvest Knoll Ct
- 14906 Harvest Knoll Ct
- 14944 Harvest Knoll Ct
- 14888 Harvest Knoll Ct
- 14871 Harvest Knoll Ct
- 14942 Silent Bluff Ct
- 14923 Silent Bluff Ct
- 14905 Silent Bluff Ct
- 14941 Silent Bluff Ct
- 14609 Golden Fox Ct
- 14887 Silent Bluff Ct
- 14877 Woodruff Ln
- 14869 Silent Bluff Ct
- 14889 Woodruff Ln
- 14901 Woodruff Ln
- 14662 Golden Fox Ct