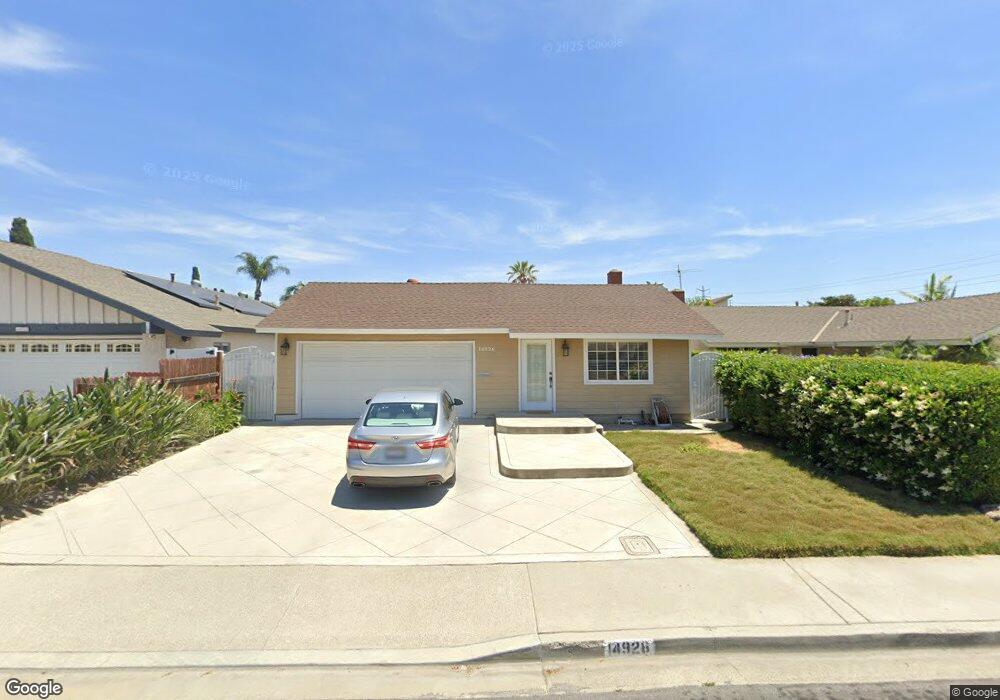
14926 Doheny Cir Irvine, CA 92604
Walnut NeighborhoodEstimated Value: $1,401,000 - $1,450,000
4
Beds
2
Baths
1,588
Sq Ft
$894/Sq Ft
Est. Value
About This Home
This home is located at 14926 Doheny Cir, Irvine, CA 92604 and is currently estimated at $1,419,630, approximately $893 per square foot. 14926 Doheny Cir is a home located in Orange County with nearby schools including Greentree Elementary School, Venado Middle School, and Irvine High School.
Ownership History
Date
Name
Owned For
Owner Type
Purchase Details
Closed on
Apr 23, 2008
Sold by
Patel Bhikhubhai
Bought by
Patel Bhikhubhai and Patel Taramati
Current Estimated Value
Purchase Details
Closed on
Feb 4, 2008
Sold by
Liquidation Properties Inc
Bought by
Patel Bhikhubhai
Home Financials for this Owner
Home Financials are based on the most recent Mortgage that was taken out on this home.
Original Mortgage
$370,125
Interest Rate
5.72%
Mortgage Type
Purchase Money Mortgage
Purchase Details
Closed on
Aug 16, 2007
Sold by
Velasquez Douglas and Velasquez Marlene
Bought by
Liquidation Properties Inc
Purchase Details
Closed on
Sep 22, 2004
Sold by
Velasquez Marlene
Bought by
Velasquez Douglas and Velasquez Marlene
Purchase Details
Closed on
Nov 18, 2003
Sold by
Velasquez Douglas and Velasquez Marlene
Bought by
Velasquez Marlene
Purchase Details
Closed on
Nov 4, 2003
Sold by
Velasquez Marlene
Bought by
Velasquez Douglas and Velasquez Marlene
Purchase Details
Closed on
Feb 14, 2000
Sold by
Velasquez Douglas
Bought by
Velasquez Marlene
Home Financials for this Owner
Home Financials are based on the most recent Mortgage that was taken out on this home.
Original Mortgage
$222,053
Interest Rate
5.55%
Purchase Details
Closed on
Feb 4, 2000
Sold by
Loch Joan A
Bought by
Velasquez Marlene
Home Financials for this Owner
Home Financials are based on the most recent Mortgage that was taken out on this home.
Original Mortgage
$222,053
Interest Rate
5.55%
Purchase Details
Closed on
Mar 1, 1996
Sold by
Tabing Magdalena V
Bought by
Loch Joan A and Loch Louis N
Home Financials for this Owner
Home Financials are based on the most recent Mortgage that was taken out on this home.
Original Mortgage
$151,900
Interest Rate
6.98%
Mortgage Type
Balloon
Create a Home Valuation Report for This Property
The Home Valuation Report is an in-depth analysis detailing your home's value as well as a comparison with similar homes in the area
Home Values in the Area
Average Home Value in this Area
Purchase History
| Date | Buyer | Sale Price | Title Company |
|---|---|---|---|
| Patel Bhikhubhai | -- | None Available | |
| Patel Bhikhubhai | $493,500 | Chicago Title Company | |
| Liquidation Properties Inc | $502,500 | Lsi Title | |
| Velasquez Douglas | -- | -- | |
| Velasquez Marlene | -- | -- | |
| Velasquez Douglas | -- | Fidelity National Financial | |
| Velasquez Marlene | -- | First American Title Ins Co | |
| Velasquez Marlene | $247,000 | First American Title Ins Co | |
| Loch Joan A | $169,000 | Chicago Title Co |
Source: Public Records
Mortgage History
| Date | Status | Borrower | Loan Amount |
|---|---|---|---|
| Previous Owner | Patel Bhikhubhai | $370,125 | |
| Previous Owner | Velasquez Marlene | $222,053 | |
| Previous Owner | Loch Joan A | $151,900 |
Source: Public Records
Tax History Compared to Growth
Tax History
| Year | Tax Paid | Tax Assessment Tax Assessment Total Assessment is a certain percentage of the fair market value that is determined by local assessors to be the total taxable value of land and additions on the property. | Land | Improvement |
|---|---|---|---|---|
| 2025 | $6,635 | $639,464 | $489,211 | $150,253 |
| 2024 | $6,635 | $626,926 | $479,619 | $147,307 |
| 2023 | $6,463 | $614,634 | $470,215 | $144,419 |
| 2022 | $6,337 | $602,583 | $460,995 | $141,588 |
| 2021 | $6,191 | $590,768 | $451,956 | $138,812 |
| 2020 | $6,155 | $584,711 | $447,322 | $137,389 |
| 2019 | $6,098 | $581,090 | $438,551 | $142,539 |
| 2018 | $5,989 | $569,697 | $429,952 | $139,745 |
| 2017 | $5,865 | $558,527 | $421,522 | $137,005 |
| 2016 | $5,605 | $547,576 | $413,257 | $134,319 |
| 2015 | $5,520 | $539,351 | $407,049 | $132,302 |
| 2014 | $5,413 | $528,786 | $399,075 | $129,711 |
Source: Public Records
Map
Nearby Homes
- 14921 Pinehaven Rd
- 4862 Gainsport Cir
- 32 Goldenbush
- 5011 Yearling Ave
- 4801 Redbluff Cir
- 15071 Talley St
- 5071 Bayonne Cir
- 57 Pinewood Unit 29
- 45 Golden Glen St Unit 75
- 26 Helena Unit 69
- 22 Firebird Unit 71
- 15232 Lille Cir
- 3871 Banyan St
- 73 Huntington Unit 322
- 14851 Jeffrey Rd Unit 135
- 14851 Jeffrey Rd Unit 248
- 14851 Jeffrey Rd Unit 61
- 14851 Jeffrey Rd Unit 241
- 14851 Jeffrey Rd Unit 145
- 14851 Jeffrey Rd Unit 246
- 14922 Doheny Cir
- 14932 Doheny Cir
- 14912 Doheny Cir
- 14942 Doheny Cir
- 14925 Laurelgrove Cir
- 14931 Laurelgrove Cir
- 14921 Laurelgrove Cir
- 14941 Laurelgrove Cir
- 14911 Laurelgrove Cir
- 14902 Doheny Cir
- 14925 Doheny Cir
- 14931 Doheny Cir
- 14921 Doheny Cir
- 14901 Laurelgrove Cir
- 14911 Doheny Cir
- 14892 Doheny Cir
- 14901 Doheny Cir
- 14891 Laurelgrove Cir
- 4532 Roxbury Dr
- 4522 Roxbury Dr