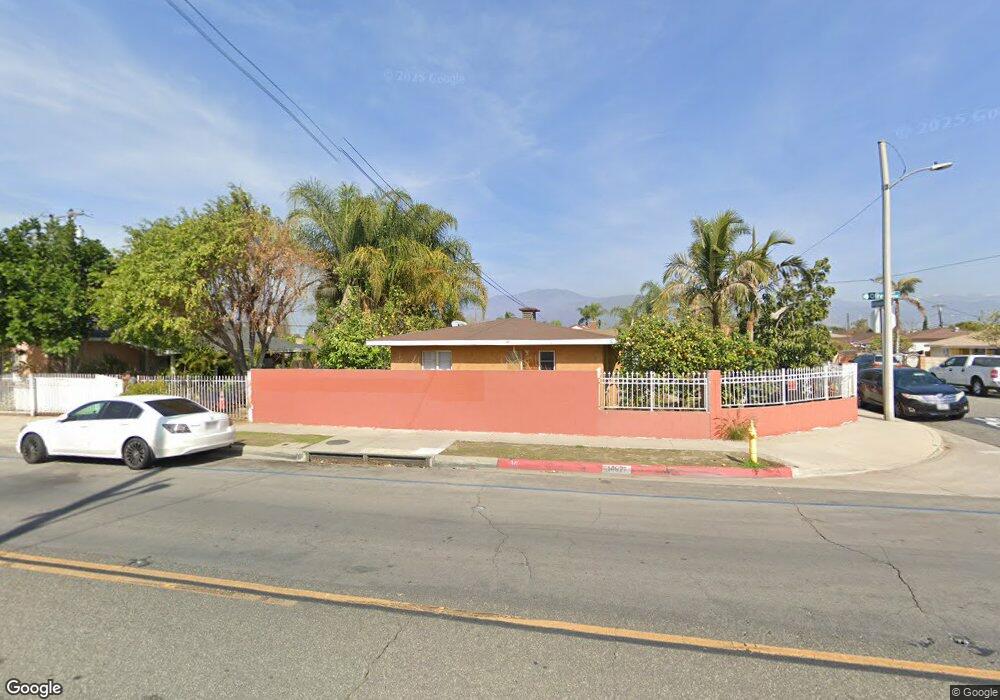
14927 Olive St Baldwin Park, CA 91706
Estimated Value: $556,000 - $693,000
3
Beds
1
Bath
974
Sq Ft
$666/Sq Ft
Est. Value
About This Home
This home is located at 14927 Olive St, Baldwin Park, CA 91706 and is currently estimated at $648,941, approximately $666 per square foot. 14927 Olive St is a home located in Los Angeles County with nearby schools including Pleasant View Elementary, Baldwin Park High School, and St. John The Baptist School.
Ownership History
Date
Name
Owned For
Owner Type
Purchase Details
Closed on
May 3, 2001
Sold by
Ratnaweera Sanjeewa
Bought by
Home Owners Equity Corp
Current Estimated Value
Purchase Details
Closed on
Aug 10, 1999
Sold by
Hud
Bought by
Ratnaweera Sanjeewa
Home Financials for this Owner
Home Financials are based on the most recent Mortgage that was taken out on this home.
Original Mortgage
$105,133
Interest Rate
7.89%
Mortgage Type
FHA
Purchase Details
Closed on
May 27, 1999
Sold by
Chase Manhattan Mtg Corp
Bought by
Hud
Purchase Details
Closed on
Apr 1, 1999
Sold by
Bonilla Marta
Bought by
Chase Manhattan Mtg Corp
Purchase Details
Closed on
Mar 3, 1998
Sold by
Martinez David F
Bought by
Bonilla Marta
Home Financials for this Owner
Home Financials are based on the most recent Mortgage that was taken out on this home.
Original Mortgage
$111,452
Interest Rate
7%
Mortgage Type
FHA
Create a Home Valuation Report for This Property
The Home Valuation Report is an in-depth analysis detailing your home's value as well as a comparison with similar homes in the area
Home Values in the Area
Average Home Value in this Area
Purchase History
| Date | Buyer | Sale Price | Title Company |
|---|---|---|---|
| Home Owners Equity Corp | $125,000 | -- | |
| Ratnaweera Sanjeewa | $106,000 | Provident Title | |
| Hud | -- | Fidelity National Title Ins | |
| Chase Manhattan Mtg Corp | $119,043 | Fidelity National Title Ins | |
| Bonilla Marta | $112,000 | First American | |
| Martinez David F | -- | First American |
Source: Public Records
Mortgage History
| Date | Status | Borrower | Loan Amount |
|---|---|---|---|
| Previous Owner | Ratnaweera Sanjeewa | $105,133 | |
| Previous Owner | Bonilla Marta | $111,452 |
Source: Public Records
Tax History
| Year | Tax Paid | Tax Assessment Tax Assessment Total Assessment is a certain percentage of the fair market value that is determined by local assessors to be the total taxable value of land and additions on the property. | Land | Improvement |
|---|---|---|---|---|
| 2025 | $3,322 | $237,330 | $157,764 | $79,566 |
| 2024 | $3,322 | $232,677 | $154,671 | $78,006 |
| 2023 | $3,286 | $228,116 | $151,639 | $76,477 |
| 2022 | $3,340 | $223,644 | $148,666 | $74,978 |
| 2021 | $3,289 | $219,259 | $145,751 | $73,508 |
| 2019 | $3,098 | $212,758 | $141,429 | $71,329 |
| 2018 | $2,902 | $208,587 | $138,656 | $69,931 |
| 2016 | $2,732 | $200,489 | $133,273 | $67,216 |
| 2015 | $2,801 | $197,479 | $131,272 | $66,207 |
| 2014 | $2,767 | $193,612 | $128,701 | $64,911 |
Source: Public Records
Map
Nearby Homes
- 14674 Via el Camino
- 15188 Masline St
- 4816 Elizabeth St
- 4912 Elizabeth St
- 4539 Maine Ave
- 14621 1/2 Clark St
- 2131 W San Bernardino Rd Unit 46
- 2131 W San Bernardino Rd Unit 35
- 4524 Landis Ave
- 5108 Baldwin Park Blvd
- 14506 Clark St Unit 6
- 15228 Ramona Blvd
- 15271 Adams Dr
- 4731 4733 Baldwin Park Blvd
- 3142621 Pioneer Town
- 14053 Olive St
- 1823 W Palm Dr
- 602 Park Shadow Ct
- 4306 Baldwin Park Blvd
- 4453 Benham Ave
- 14923 Olive St
- 4811 Stancroft Ave
- 4800 Stancroft Ave
- 4821 Stancroft Ave
- 4814 Stancroft Ave
- 4806 Park Ave
- 4802 Park Ave
- 4812 Park Ave
- 14945 Olive St
- 4818 Stancroft Ave
- 4827 Stancroft Ave
- 4818 Park Ave
- 4822 Stancroft Ave
- 4833 Stancroft Ave
- 4822 Park Ave
- 4828 Stancroft Ave
- 4828 Park Ave
- 4837 Stancroft Ave
- 15005 Olive St
- 4834 Stancroft Ave