Estimated Value: $1,230,331 - $1,518,000
4
Beds
2
Baths
2,341
Sq Ft
$592/Sq Ft
Est. Value
About This Home
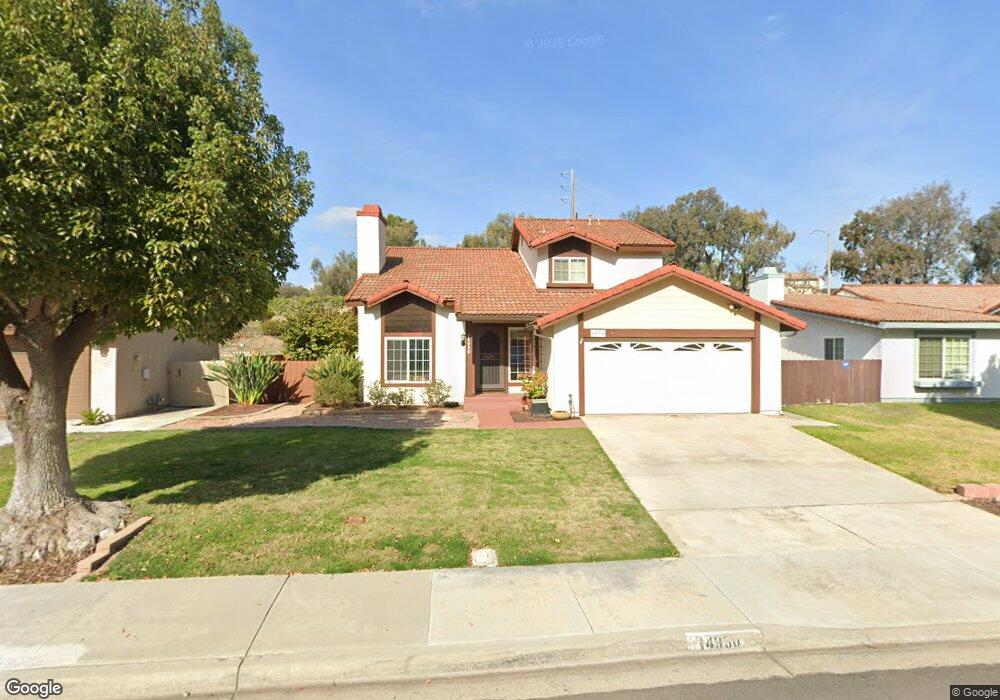
This home is located at 14930 Amso St, Poway, CA 92064 and is currently estimated at $1,385,333, approximately $591 per square foot. 14930 Amso St is a home located in San Diego County with nearby schools including Painted Rock Elementary, Bernardo Heights Middle, and Rancho Bernardo High.
Ownership History
Date
Name
Owned For
Owner Type
Purchase Details
Closed on
Mar 29, 2012
Sold by
Johnson Robert M and Johnson Lourdes P
Bought by
Johnson Robert M and Johnson Lourdes P
Current Estimated Value
Purchase Details
Closed on
May 24, 1988
Bought by
Johnson Robert M Lourdes P
Purchase Details
Closed on
Feb 27, 1985
Create a Home Valuation Report for This Property
The Home Valuation Report is an in-depth analysis detailing your home's value as well as a comparison with similar homes in the area
Home Values in the Area
Average Home Value in this Area
Purchase History
| Date | Buyer | Sale Price | Title Company |
|---|---|---|---|
| Johnson Robert M | -- | None Available | |
| Johnson Robert M Lourdes P | $169,000 | -- | |
| -- | $118,000 | -- |
Source: Public Records
Tax History
| Year | Tax Paid | Tax Assessment Tax Assessment Total Assessment is a certain percentage of the fair market value that is determined by local assessors to be the total taxable value of land and additions on the property. | Land | Improvement |
|---|---|---|---|---|
| 2025 | $3,695 | $323,437 | $103,800 | $219,637 |
| 2024 | $3,695 | $317,096 | $101,765 | $215,331 |
| 2023 | $3,619 | $310,879 | $99,770 | $211,109 |
| 2022 | $3,560 | $304,784 | $97,814 | $206,970 |
| 2021 | $3,515 | $298,809 | $95,897 | $202,912 |
| 2020 | $3,469 | $295,746 | $94,914 | $200,832 |
| 2019 | $3,383 | $289,948 | $93,053 | $196,895 |
| 2018 | $3,291 | $284,264 | $91,229 | $193,035 |
| 2017 | $3,207 | $278,691 | $89,441 | $189,250 |
| 2016 | $3,142 | $273,228 | $87,688 | $185,540 |
| 2015 | $3,097 | $269,125 | $86,371 | $182,754 |
| 2014 | $3,028 | $263,855 | $84,680 | $179,175 |
Source: Public Records
Map
Nearby Homes
- 0 La Manda Dr Unit 260002248
- 14811 Summerbreeze Way
- 14872 Summerbreeze Way
- 14613 Plumwood St
- 12708 Casa Avenida
- Hawkeye Waverly Downs Way Unit A70
- 14230 Jonah Way
- 14138 Brent Wilsey Place Unit 3
- 14110 Brent Wilsey Place Unit 1
- 14725 Fieldview Way
- 11908 Tivoli Park Row Unit 7
- 12333 Bachimba Ct
- 12047 Tivoli Park Row Unit 4
- 12047 Alta Carmel Ct Unit 189
- 12059 Alta Carmel Ct Unit 167
- 12023 Alta Carmel Ct Unit 253
- 12019 Alta Carmel Ct Unit 282
- 12059 Alta Carmel Ct Unit 168
- 14109 Arbolitos Dr
- 12124 Riley Ln
- 14934 Amso St
- 14926 Amso St
- 14938 Amso St
- 14922 Amso St
- 14929 Amso St
- 14942 Amso St
- 14933 Amso St
- 14909 Amso St
- 14918 Amso St
- 14946 Amso St
- 14934 La Manda Dr
- 14914 Amso St
- 14945 Amso St
- 14926 La Manda Dr
- 14910 Amso St
- 14921 Conchos Dr
- 14925 Conchos Dr
- 14950 Amso St
- 14918 La Manda Dr
- 14929 Conchos Dr
Your Personal Tour Guide
Ask me questions while you tour the home.