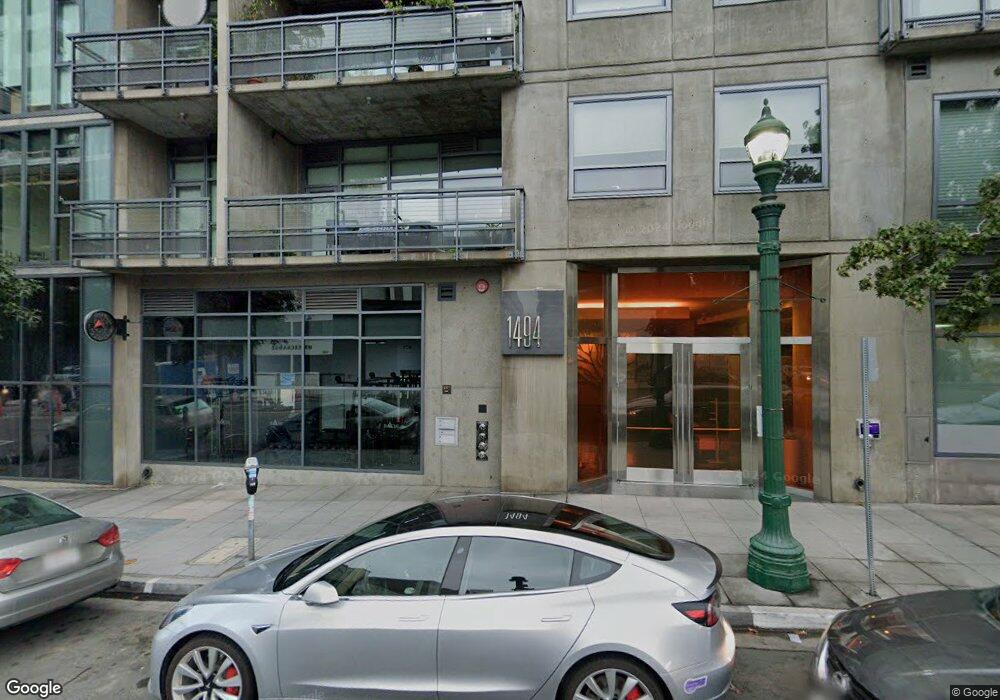
Aperture 1494 Union St Unit 1011 San Diego, CA 92101
Little Italy NeighborhoodEstimated Value: $1,354,000 - $1,695,000
2
Beds
3
Baths
2,019
Sq Ft
$738/Sq Ft
Est. Value
About This Home
This home is located at 1494 Union St Unit 1011, San Diego, CA 92101 and is currently estimated at $1,490,660, approximately $738 per square foot. 1494 Union St Unit 1011 is a home located in San Diego County with nearby schools including Washington Elementary School, Roosevelt International Middle School, and Museum School.
Ownership History
Date
Name
Owned For
Owner Type
Purchase Details
Closed on
Apr 27, 2018
Sold by
Parsons Eva J and The Pearson Parsons Joint Revo
Bought by
Woo Victor and The Victor Woo Separate Proper
Current Estimated Value
Purchase Details
Closed on
Dec 16, 2014
Sold by
Hall Michael F and Hall Elizabeth F
Bought by
Pearson/Parsons Joint Revocable Trust and Parsons Eva J
Purchase Details
Closed on
Apr 8, 2010
Sold by
Citymark Union Street Llc
Bought by
Hall Michael F and Hall Elizabeth F
Purchase Details
Closed on
May 21, 2009
Sold by
Citymark Union Street Llc
Bought by
Hall Michael F and Hall Elizabeth F
Home Financials for this Owner
Home Financials are based on the most recent Mortgage that was taken out on this home.
Original Mortgage
$546,250
Interest Rate
4.83%
Mortgage Type
Purchase Money Mortgage
Create a Home Valuation Report for This Property
The Home Valuation Report is an in-depth analysis detailing your home's value as well as a comparison with similar homes in the area
Home Values in the Area
Average Home Value in this Area
Purchase History
| Date | Buyer | Sale Price | Title Company |
|---|---|---|---|
| Woo Victor | $1,083,000 | Fidelity National Title | |
| Pearson/Parsons Joint Revocable Trust | $905,000 | First American Title | |
| Hall Michael F | -- | Accommodation | |
| Hall Michael F | $800,000 | Chicago Title Company |
Source: Public Records
Mortgage History
| Date | Status | Borrower | Loan Amount |
|---|---|---|---|
| Previous Owner | Hall Michael F | $546,250 |
Source: Public Records
Tax History Compared to Growth
Tax History
| Year | Tax Paid | Tax Assessment Tax Assessment Total Assessment is a certain percentage of the fair market value that is determined by local assessors to be the total taxable value of land and additions on the property. | Land | Improvement |
|---|---|---|---|---|
| 2025 | $15,259 | $1,232,264 | $768,032 | $464,232 |
| 2024 | $15,259 | $1,208,103 | $752,973 | $455,130 |
| 2023 | $14,913 | $1,184,415 | $738,209 | $446,206 |
| 2022 | $14,509 | $1,161,192 | $723,735 | $437,457 |
| 2021 | $14,395 | $1,138,425 | $709,545 | $428,880 |
| 2020 | $14,225 | $1,126,753 | $702,270 | $424,483 |
| 2019 | $13,961 | $1,104,660 | $688,500 | $416,160 |
| 2018 | $9,583 | $787,260 | $452,451 | $334,809 |
| 2017 | $9,349 | $771,825 | $443,580 | $328,245 |
| 2016 | $9,192 | $756,692 | $434,883 | $321,809 |
| 2015 | $10,361 | $857,184 | $321,443 | $535,741 |
| 2014 | $10,189 | $840,394 | $315,147 | $525,247 |
Source: Public Records
About Aperture
Map
Nearby Homes
- 1494 Union St Unit 403
- 350 W Ash St Unit 1207
- 425 W Beech St Unit 1706
- 425 W Beech St Unit 1003
- 425 W Beech St Unit 1504
- 425 W Beech St Unit 223
- 425 W Beech St Unit 1205
- 425 W Beech St Unit 722
- 1545 State St Unit TH2
- 300 W Beech St Unit 1101
- 300 W Beech St Unit 1909
- 1501 Front St Unit 338
- 1620 Union St Unit 1
- 1501 India St Unit 605
- 1501 India St Unit 608
- 1435 India St Unit 409
- 1601 India St Unit 307
- 1601 India St Unit 207
- 1601 India St Unit 105
- 1601 India St Unit 116
- 1494 Union St Unit G-1
- 1494 Union St
- 1494 Union St Unit 1010
- 1494 Union St Unit 1008
- 1494 Union St Unit 1007
- 1494 Union St Unit 1006
- 1494 Union St Unit 1005
- 1494 Union St Unit 1004
- 1494 Union St Unit 1002
- 1494 Union St Unit 1001
- 1494 Union St Unit 909
- 1494 Union St Unit 405
- 1494 Union St Unit 404
- 1494 Union St Unit 402
- 1494 Union St Unit 401
- 1494 Union St Unit 309
- 1494 Union St Unit 308
- 1494 Union St Unit 307
- 1494 Union St Unit 306
- 1494 Union St Unit 305