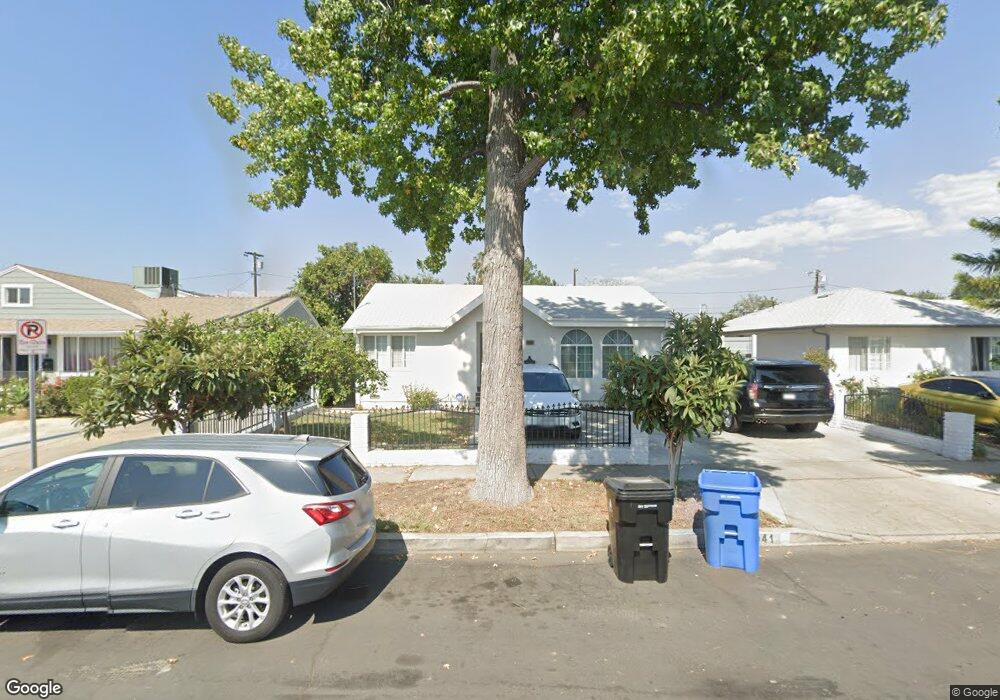
14941 Marlin Place van Nuys, CA 91405
Estimated Value: $926,000 - $1,157,000
4
Beds
3
Baths
1,960
Sq Ft
$511/Sq Ft
Est. Value
About This Home
This home is located at 14941 Marlin Place, van Nuys, CA 91405 and is currently estimated at $1,002,228, approximately $511 per square foot. 14941 Marlin Place is a home located in Los Angeles County with nearby schools including Columbus Avenue, Robert Fulton College Preparatory, and Van Nuys High School.
Ownership History
Date
Name
Owned For
Owner Type
Purchase Details
Closed on
Jun 4, 2015
Sold by
Azizyan Artak
Bought by
Azizyan Artak and Gazaryan Narine
Current Estimated Value
Home Financials for this Owner
Home Financials are based on the most recent Mortgage that was taken out on this home.
Original Mortgage
$417,000
Outstanding Balance
$321,705
Interest Rate
3.64%
Mortgage Type
New Conventional
Estimated Equity
$680,524
Purchase Details
Closed on
Jun 19, 2002
Sold by
Baghikian Sarkis
Bought by
Azizyan Artak
Home Financials for this Owner
Home Financials are based on the most recent Mortgage that was taken out on this home.
Original Mortgage
$290,500
Interest Rate
6.71%
Purchase Details
Closed on
May 16, 2002
Sold by
Baghikian Mary
Bought by
Baghikian Sarkis
Home Financials for this Owner
Home Financials are based on the most recent Mortgage that was taken out on this home.
Original Mortgage
$290,500
Interest Rate
6.71%
Create a Home Valuation Report for This Property
The Home Valuation Report is an in-depth analysis detailing your home's value as well as a comparison with similar homes in the area
Home Values in the Area
Average Home Value in this Area
Purchase History
| Date | Buyer | Sale Price | Title Company |
|---|---|---|---|
| Azizyan Artak | -- | Lawyers Title | |
| Azizyan Artak | $323,000 | First American Title Co | |
| Baghikian Sarkis | -- | First American Title Co |
Source: Public Records
Mortgage History
| Date | Status | Borrower | Loan Amount |
|---|---|---|---|
| Open | Azizyan Artak | $417,000 | |
| Closed | Azizyan Artak | $290,500 | |
| Previous Owner | Baghikian Sarkis | $290,625 | |
| Closed | Baghikian Sarkis | $46,500 |
Source: Public Records
Tax History
| Year | Tax Paid | Tax Assessment Tax Assessment Total Assessment is a certain percentage of the fair market value that is determined by local assessors to be the total taxable value of land and additions on the property. | Land | Improvement |
|---|---|---|---|---|
| 2025 | $6,177 | $500,461 | $226,364 | $274,097 |
| 2024 | $6,177 | $490,649 | $221,926 | $268,723 |
| 2023 | $6,060 | $481,029 | $217,575 | $263,454 |
| 2022 | $5,783 | $471,598 | $213,309 | $258,289 |
| 2021 | $5,704 | $462,352 | $209,127 | $253,225 |
| 2019 | $5,536 | $448,640 | $202,925 | $245,715 |
| 2018 | $5,383 | $439,845 | $198,947 | $240,898 |
| 2016 | $5,128 | $422,768 | $191,223 | $231,545 |
| 2015 | $5,053 | $416,418 | $188,351 | $228,067 |
| 2014 | $5,074 | $408,262 | $184,662 | $223,600 |
Source: Public Records
Map
Nearby Homes
- 14931 Vose St
- 14929 Vose St
- 7061 Kester Ave Unit C
- 15033 Hartland St
- 6840 Kester Ave
- 14840 Hartland St
- 14734 Marlin Place
- 15050 Sherman Way Unit 190
- 14841 Archwood St
- 15051 Sherman Way
- 15051 Sherman Way Unit F
- 6903 Halbrent Ave
- 7117 Kester Ave
- 14821 Sherman Way Unit 12
- 6912 Cedros Ave
- 6842 Cedros Ave
- 15155 Sherman Way Unit 14
- 14665 Sherman Way
- 14703 Archwood St
- 14835 Kittridge St
- 14935 Marlin Place
- 14945 Marlin Place
- 14951 Marlin Place
- 14929 Marlin Place
- 14933 Marlin Place
- 14927 Marlin Place
- 14957 Marlin Place
- 7009 N Moonlight Ln
- 14938 Vose St
- 14940 Marlin Place
- 14928 Vose St Unit 1
- 14923 Marlin Place
- 14934 Marlin Place
- 14944 Marlin Place
- 14961 Marlin Place
- 7011 Liberty Dr
- 7011 Liberty Dr
- 14928 Marlin Place
- 14950 Marlin Place
- 14950 Vose St
Your Personal Tour Guide
Ask me questions while you tour the home.