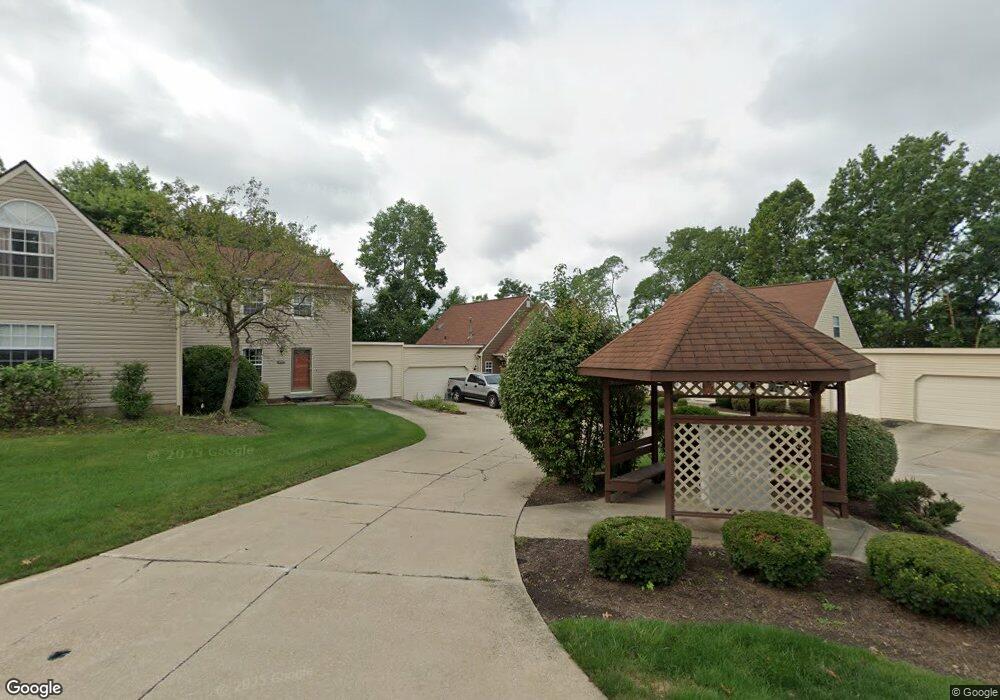
14949 Royal Ridge Ln Unit R51 North Royalton, OH 44133
Estimated Value: $216,000 - $235,000
2
Beds
2
Baths
1,666
Sq Ft
$136/Sq Ft
Est. Value
About This Home
This home is located at 14949 Royal Ridge Ln Unit R51, North Royalton, OH 44133 and is currently estimated at $225,806, approximately $135 per square foot. 14949 Royal Ridge Ln Unit R51 is a home located in Cuyahoga County with nearby schools including North Royalton Middle School, North Royalton High School, and Saint Albert the Great Roman Catholic School.
Ownership History
Date
Name
Owned For
Owner Type
Purchase Details
Closed on
Apr 4, 2011
Sold by
The Bank Of New York Mellon
Bought by
Dunning James D and Dunning Sheila
Current Estimated Value
Purchase Details
Closed on
Jul 28, 2010
Sold by
Vaccarella Giacinto and Vaccarella Giacinto R
Bought by
The Bank Of New York Mellon and The Bank Of New York
Purchase Details
Closed on
Feb 14, 2005
Sold by
Kannen James R
Bought by
Vaccarella Giacinto R
Home Financials for this Owner
Home Financials are based on the most recent Mortgage that was taken out on this home.
Original Mortgage
$113,600
Interest Rate
6.65%
Mortgage Type
Unknown
Purchase Details
Closed on
Jul 20, 1990
Sold by
Skrycki Ann M
Bought by
Kannen James R
Purchase Details
Closed on
Jan 1, 1989
Bought by
Skrycki Ann M
Create a Home Valuation Report for This Property
The Home Valuation Report is an in-depth analysis detailing your home's value as well as a comparison with similar homes in the area
Home Values in the Area
Average Home Value in this Area
Purchase History
| Date | Buyer | Sale Price | Title Company |
|---|---|---|---|
| Dunning James D | $76,500 | Fidelity Land Title | |
| The Bank Of New York Mellon | $66,667 | None Available | |
| Vaccarella Giacinto R | $142,000 | Land Title Agency | |
| Kannen James R | $110,000 | -- | |
| Skrycki Ann M | -- | -- |
Source: Public Records
Mortgage History
| Date | Status | Borrower | Loan Amount |
|---|---|---|---|
| Previous Owner | Vaccarella Giacinto R | $113,600 | |
| Closed | Vaccarella Giacinto R | $28,400 |
Source: Public Records
Tax History Compared to Growth
Tax History
| Year | Tax Paid | Tax Assessment Tax Assessment Total Assessment is a certain percentage of the fair market value that is determined by local assessors to be the total taxable value of land and additions on the property. | Land | Improvement |
|---|---|---|---|---|
| 2024 | $3,659 | $63,000 | $6,300 | $56,700 |
| 2023 | $2,297 | $36,270 | $4,450 | $31,820 |
| 2022 | $2,282 | $36,260 | $4,450 | $31,820 |
| 2021 | $2,306 | $36,260 | $4,450 | $31,820 |
| 2020 | $2,166 | $32,380 | $3,960 | $28,420 |
| 2019 | $2,102 | $92,500 | $11,300 | $81,200 |
| 2018 | $1,881 | $32,380 | $3,960 | $28,420 |
| 2017 | $1,749 | $25,450 | $4,620 | $20,830 |
| 2016 | $1,639 | $25,450 | $4,620 | $20,830 |
| 2015 | $1,738 | $25,450 | $4,620 | $20,830 |
| 2014 | $1,738 | $26,780 | $4,870 | $21,910 |
Source: Public Records
Map
Nearby Homes
- 7400 Akins Rd
- 6689 Willow Lake Dr
- 7332 Creekwood Dr Unit 4B
- 8381 N Akins Rd Unit H7
- 13831 Woodcroft Trace
- 5299 Whistler Ct
- 5213 Royalton Rd
- S/L Margaret Dr
- 7554 Margaret Dr
- 7595 Margaret Dr
- 7545 Margaret Dr
- 7585 Margaret Dr
- 7575 Margaret Dr
- 7535 Margaret Dr
- 7555 Margaret Dr
- 7600 Margaret Dr
- 7564 Margaret Dr
- 7574 Margaret Dr
- 16577 State Rd
- 12701 Gordon St
- 14945 Royal Ridge Ln
- 14947 Royal Ridge Ln
- 14951 Royal Ridge Ln Unit E14
- 14955 Royal Ridge Ln Unit E16
- 14953 Royal Ridge Ln Unit E15
- 14939 Royal Ridge Ln Unit Q46
- 14941 Royal Ridge Ln Unit 47Q
- 14943 Royal Ridge Ln
- 14937 Royal Ridge Ln
- 14943 Royal Ridge Ln Unit 48
- 14944 Royal Ridge Ln Unit S53
- 14942 Royal Ridge Ln Unit S54
- 14956 Royal Ridge Ln
- 14940 Royal Ridge Ln
- 14940 Royal Ridge Ln Unit 55
- 14958 Royal Ridge Ln
- 14959 Royal Ridge Ln
- 14957 Royal Ridge Ln
- 14959 Royal Ridge Ln Unit 18
- 14957 Royal Ridge Ln Unit 17