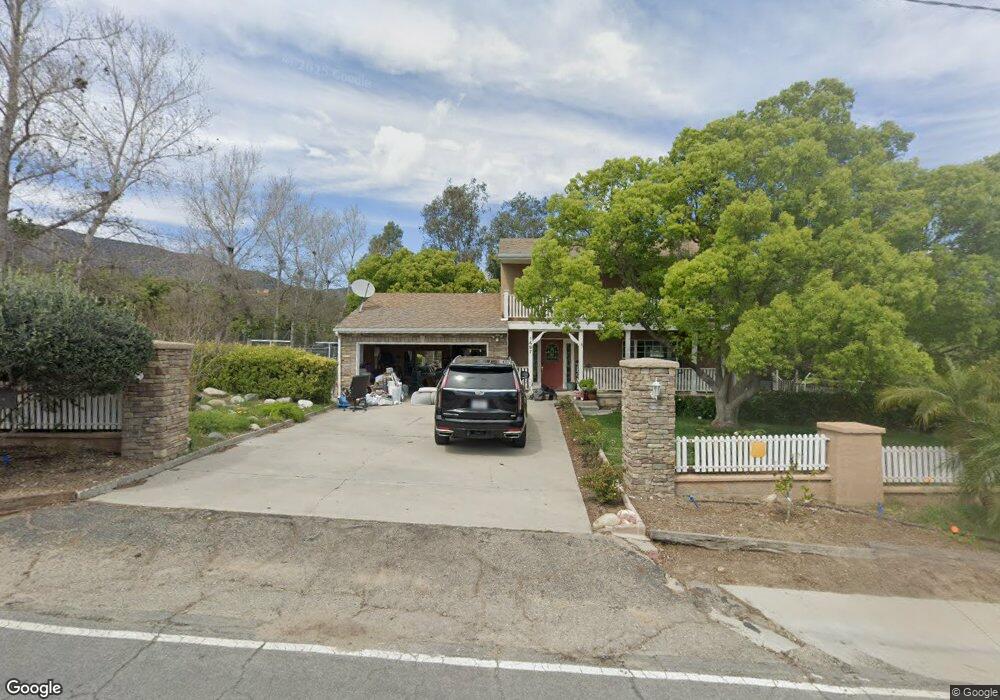
1495 Sycamore Rd Fillmore, CA 93015
Estimated Value: $643,000 - $1,012,000
1
Bed
2
Baths
1,216
Sq Ft
$636/Sq Ft
Est. Value
About This Home
This home is located at 1495 Sycamore Rd, Fillmore, CA 93015 and is currently estimated at $773,915, approximately $636 per square foot. 1495 Sycamore Rd is a home located in Ventura County with nearby schools including Fillmore Senior High.
Ownership History
Date
Name
Owned For
Owner Type
Purchase Details
Closed on
Oct 5, 2021
Sold by
Barajas Evaristo and Barajas Guillermina
Bought by
Barajas Evaristo and Barajas Guillermina
Current Estimated Value
Purchase Details
Closed on
Sep 24, 2019
Sold by
Vazquez Garfield Irma and Vazques Irma Ruiz
Bought by
Barajas Evaristo and Barajas Guillermina
Home Financials for this Owner
Home Financials are based on the most recent Mortgage that was taken out on this home.
Original Mortgage
$448,000
Outstanding Balance
$391,604
Interest Rate
3.5%
Mortgage Type
New Conventional
Estimated Equity
$382,311
Purchase Details
Closed on
Oct 24, 2011
Sold by
Vasquez Garfield Irma
Bought by
Vasquez Garfield Irma
Purchase Details
Closed on
Nov 13, 2003
Sold by
Garfield William L
Bought by
Garfield William L and Vazquez Irma R
Purchase Details
Closed on
Feb 27, 2003
Sold by
Vazquez Irma
Bought by
Garfield William L
Home Financials for this Owner
Home Financials are based on the most recent Mortgage that was taken out on this home.
Original Mortgage
$150,000
Interest Rate
5.54%
Create a Home Valuation Report for This Property
The Home Valuation Report is an in-depth analysis detailing your home's value as well as a comparison with similar homes in the area
Home Values in the Area
Average Home Value in this Area
Purchase History
| Date | Buyer | Sale Price | Title Company |
|---|---|---|---|
| Barajas Evaristo | -- | None Available | |
| Barajas Evaristo | $560,000 | Ticor Title Riverside | |
| Vasquez Garfield Irma | -- | None Available | |
| Garfield William L | -- | -- | |
| Garfield William L | -- | Old Republic Title Ins Co |
Source: Public Records
Mortgage History
| Date | Status | Borrower | Loan Amount |
|---|---|---|---|
| Open | Barajas Evaristo | $448,000 | |
| Previous Owner | Garfield William L | $150,000 |
Source: Public Records
Tax History Compared to Growth
Tax History
| Year | Tax Paid | Tax Assessment Tax Assessment Total Assessment is a certain percentage of the fair market value that is determined by local assessors to be the total taxable value of land and additions on the property. | Land | Improvement |
|---|---|---|---|---|
| 2025 | $6,755 | $612,440 | $398,089 | $214,351 |
| 2024 | $6,755 | $600,432 | $390,283 | $210,149 |
| 2023 | $6,662 | $588,659 | $382,630 | $206,029 |
| 2022 | $6,158 | $577,117 | $375,127 | $201,990 |
| 2021 | $7,011 | $565,801 | $367,771 | $198,030 |
| 2020 | $6,501 | $560,000 | $364,000 | $196,000 |
| 2019 | $1,658 | $143,141 | $15,284 | $127,857 |
| 2018 | $1,624 | $140,335 | $14,985 | $125,350 |
| 2017 | $1,631 | $137,585 | $14,692 | $122,893 |
| 2016 | $1,511 | $134,888 | $14,404 | $120,484 |
| 2015 | $1,467 | $132,864 | $14,189 | $118,675 |
| 2014 | $1,466 | $130,263 | $13,912 | $116,351 |
Source: Public Records
Map
Nearby Homes
- 1369 Cliff Ave
- 1497 Sycamore Rd
- 1295 Cliff Ave
- 0 Sycamore Rd
- 1494 Sycamore Rd
- 1313 Cliff Ave
- 1371 Cliff Ave
- 1325 Cliff Ave
- 1365 Oak Ave
- 1197 Cliff Ave
- 1500 Sycamore Rd
- 1192 Cliff Ave
- 1329 Cliff Ave
- 1171 Cliff Ave
- 1520 Sycamore Rd
- 1405 Oak Ave
- 1159 Cliff Ave
- 1157 Cliff Ave
- 1143 Cliff Ave
- 1186 Oak Ave