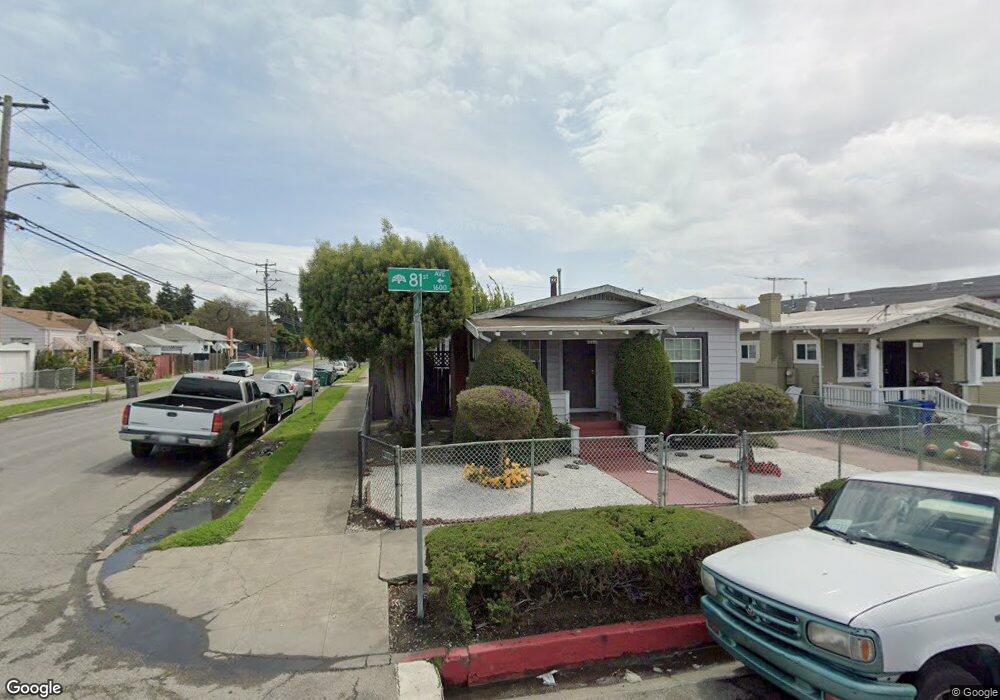
1496 81st Ave Oakland, CA 94621
Arroyo Viejo NeighborhoodEstimated Value: $361,000 - $428,000
3
Beds
1
Bath
908
Sq Ft
$442/Sq Ft
Est. Value
About This Home
This home is located at 1496 81st Ave, Oakland, CA 94621 and is currently estimated at $401,562, approximately $442 per square foot. 1496 81st Ave is a home located in Alameda County with nearby schools including East Oakland Pride Elementary School, Greenleaf Elementary School, and Coliseum College Prep Academy.
Ownership History
Date
Name
Owned For
Owner Type
Purchase Details
Closed on
Jun 3, 1998
Sold by
Shaw S Desiree
Bought by
Johnson Cynthia Denise
Current Estimated Value
Home Financials for this Owner
Home Financials are based on the most recent Mortgage that was taken out on this home.
Original Mortgage
$89,954
Outstanding Balance
$18,184
Interest Rate
7.17%
Mortgage Type
FHA
Estimated Equity
$383,378
Purchase Details
Closed on
Nov 11, 1997
Sold by
Federal National Mortgage Association
Bought by
Shaw S Desiree
Home Financials for this Owner
Home Financials are based on the most recent Mortgage that was taken out on this home.
Original Mortgage
$58,500
Interest Rate
7.22%
Mortgage Type
Credit Line Revolving
Purchase Details
Closed on
Mar 25, 1997
Sold by
Nguyen Minh and Hoang Lien
Bought by
Federal National Mortgage Association
Create a Home Valuation Report for This Property
The Home Valuation Report is an in-depth analysis detailing your home's value as well as a comparison with similar homes in the area
Home Values in the Area
Average Home Value in this Area
Purchase History
| Date | Buyer | Sale Price | Title Company |
|---|---|---|---|
| Johnson Cynthia Denise | $89,500 | Old Republic Title Company | |
| Shaw S Desiree | $58,500 | Old Republic Title Company | |
| Federal National Mortgage Association | $57,507 | -- |
Source: Public Records
Mortgage History
| Date | Status | Borrower | Loan Amount |
|---|---|---|---|
| Open | Johnson Cynthia Denise | $89,954 | |
| Previous Owner | Shaw S Desiree | $58,500 |
Source: Public Records
Tax History
| Year | Tax Paid | Tax Assessment Tax Assessment Total Assessment is a certain percentage of the fair market value that is determined by local assessors to be the total taxable value of land and additions on the property. | Land | Improvement |
|---|---|---|---|---|
| 2025 | $3,526 | $135,901 | $42,950 | $99,951 |
| 2024 | $3,526 | $133,100 | $42,108 | $97,992 |
| 2023 | $3,586 | $137,352 | $41,282 | $96,070 |
| 2022 | $3,425 | $127,660 | $40,473 | $94,187 |
| 2021 | $3,134 | $125,019 | $39,679 | $92,340 |
| 2020 | $3,097 | $130,667 | $39,273 | $91,394 |
| 2019 | $2,891 | $128,105 | $38,503 | $89,602 |
| 2018 | $2,833 | $125,593 | $37,748 | $87,845 |
| 2017 | $2,691 | $123,131 | $37,008 | $86,123 |
| 2016 | $2,516 | $120,717 | $36,282 | $84,435 |
| 2015 | $2,498 | $118,904 | $35,737 | $83,167 |
| 2014 | $2,421 | $116,576 | $35,038 | $81,538 |
Source: Public Records
Map
Nearby Homes
Your Personal Tour Guide
Ask me questions while you tour the home.