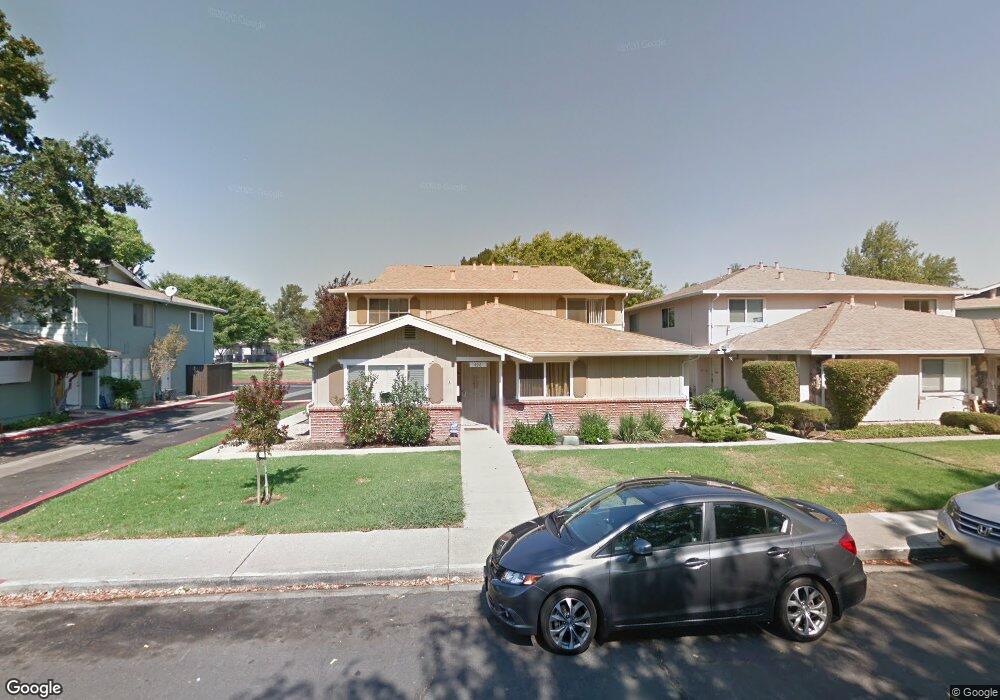
1496 Del Rio Cir Unit A Concord, CA 94518
Tree Haven NeighborhoodEstimated Value: $331,000 - $409,000
2
Beds
1
Bath
861
Sq Ft
$411/Sq Ft
Est. Value
About This Home
This home is located at 1496 Del Rio Cir Unit A, Concord, CA 94518 and is currently estimated at $354,219, approximately $411 per square foot. 1496 Del Rio Cir Unit A is a home located in Contra Costa County with nearby schools including Fair Oaks Elementary School, Oak Grove Middle School, and Ygnacio Valley High School.
Ownership History
Date
Name
Owned For
Owner Type
Purchase Details
Closed on
Sep 19, 2016
Sold by
Situ Ming
Bought by
Yi Xiao Hong
Current Estimated Value
Home Financials for this Owner
Home Financials are based on the most recent Mortgage that was taken out on this home.
Original Mortgage
$138,000
Outstanding Balance
$110,300
Interest Rate
3.45%
Mortgage Type
New Conventional
Estimated Equity
$243,919
Purchase Details
Closed on
Sep 24, 2013
Sold by
Bravo Hugo
Bought by
Situ Ming
Purchase Details
Closed on
Jul 23, 2010
Sold by
Mattox Terry L
Bought by
Bravo Hugo
Create a Home Valuation Report for This Property
The Home Valuation Report is an in-depth analysis detailing your home's value as well as a comparison with similar homes in the area
Home Values in the Area
Average Home Value in this Area
Purchase History
| Date | Buyer | Sale Price | Title Company |
|---|---|---|---|
| Yi Xiao Hong | $238,000 | Old Republic Title Company | |
| Yi Xiao Hong | -- | Old Republic Title Company | |
| Situ Ming | $160,000 | Old Republic Title Company | |
| Bravo Hugo | $85,000 | First American Title Company |
Source: Public Records
Mortgage History
| Date | Status | Borrower | Loan Amount |
|---|---|---|---|
| Open | Yi Xiao Hong | $138,000 |
Source: Public Records
Tax History Compared to Growth
Tax History
| Year | Tax Paid | Tax Assessment Tax Assessment Total Assessment is a certain percentage of the fair market value that is determined by local assessors to be the total taxable value of land and additions on the property. | Land | Improvement |
|---|---|---|---|---|
| 2025 | $3,844 | $276,215 | $162,480 | $113,735 |
| 2024 | $3,754 | $270,800 | $159,295 | $111,505 |
| 2023 | $3,754 | $265,491 | $156,172 | $109,319 |
| 2022 | $3,685 | $260,286 | $153,110 | $107,176 |
| 2021 | $3,657 | $255,183 | $150,108 | $105,075 |
| 2019 | $3,577 | $247,615 | $145,656 | $101,959 |
| 2018 | $3,354 | $242,760 | $142,800 | $99,960 |
| 2017 | $3,229 | $238,000 | $140,000 | $98,000 |
| 2016 | $2,373 | $165,684 | $77,664 | $88,020 |
| 2015 | $2,316 | $163,196 | $76,498 | $86,698 |
| 2014 | $2,263 | $160,000 | $75,000 | $85,000 |
Source: Public Records
Map
Nearby Homes
- 1040 Mohr Ln Unit C
- 1038 Mohr Ln Unit A
- 1459 Del Rio Cir Unit C
- 1356 Del Rio Cir Unit D
- 1369 Del Rio Cir Unit C
- 1064 Mohr Ln Unit C
- 134 The Trees Dr
- 1076 Mohr Ln Unit B
- 1096 Mohr Ln
- 1086 Azalea Ln
- 1091 Mohr Ln Unit D
- 1024 Bermuda Dr
- 1781 Gilardy Dr
- 1420 Pear Dr
- 1509 Wicket Ct
- 1751 Whitman Rd
- 136 Cleopatra Dr
- 1271 Hookston Rd
- 1110 Eureka Ln
- 1640 Amhurst Way
- 1496 Del Rio Cir Unit D
- 1496 Del Rio Cir Unit C
- 1496 Del Rio Cir Unit B
- 1494 Del Rio Cir Unit D
- 1494 Del Rio Cir Unit C
- 1494 Del Rio Cir Unit B
- 1494 Del Rio Cir Unit A
- 1498 Del Rio Cir
- 1498 Del Rio Cir Unit D
- 1498 Del Rio Cir Unit C
- 1498 Del Rio Cir Unit B
- 1498 Del Rio Cir Unit A
- 1495 Del Rio Cir Unit D
- 1495 Del Rio Cir Unit C
- 1495 Del Rio Cir Unit B
- 1495 Del Rio Cir Unit A
- 1488 Del Rio Cir
- 1488 Del Rio Cir Unit D
- 1488 Del Rio Cir Unit C
- 1488 Del Rio Cir Unit B