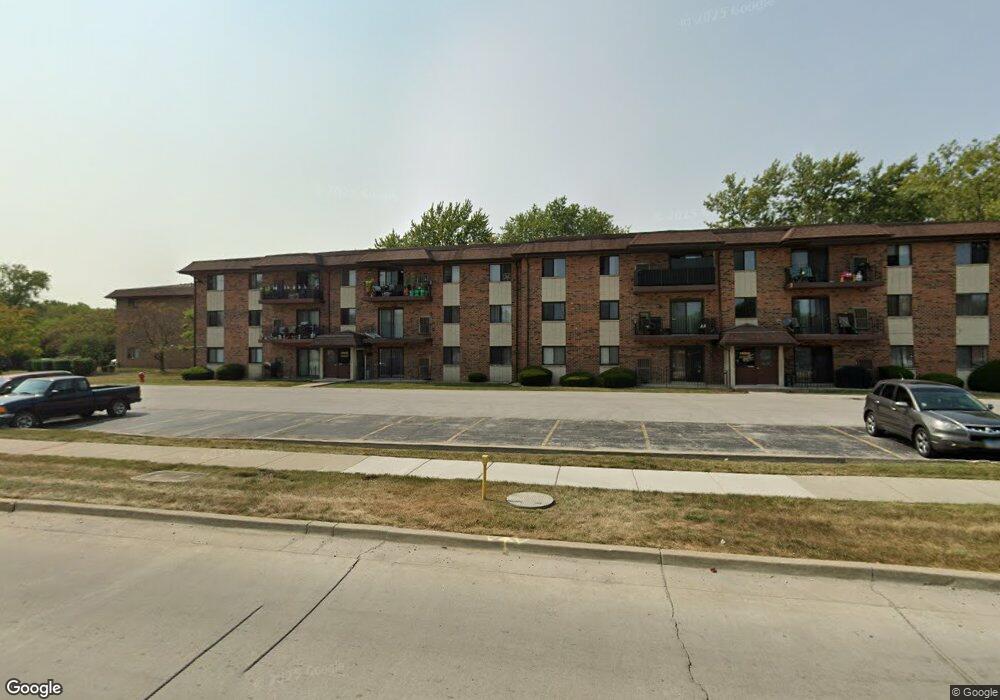
14960 Pulaski Rd Unit 12 Midlothian, IL 60445
Estimated Value: $135,325 - $149,000
2
Beds
2
Baths
1,000
Sq Ft
$143/Sq Ft
Est. Value
About This Home
This home is located at 14960 Pulaski Rd Unit 12, Midlothian, IL 60445 and is currently estimated at $142,831, approximately $142 per square foot. 14960 Pulaski Rd Unit 12 is a home located in Cook County with nearby schools including Springfield Elementary School, Bremen High School, and St. Christopher School.
Create a Home Valuation Report for This Property
The Home Valuation Report is an in-depth analysis detailing your home's value as well as a comparison with similar homes in the area
Home Values in the Area
Average Home Value in this Area
Tax History
| Year | Tax Paid | Tax Assessment Tax Assessment Total Assessment is a certain percentage of the fair market value that is determined by local assessors to be the total taxable value of land and additions on the property. | Land | Improvement |
|---|---|---|---|---|
| 2025 | $2,666 | $10,360 | $261 | $10,099 |
| 2024 | $2,666 | $10,360 | $261 | $10,099 |
| 2023 | $1,663 | $10,360 | $261 | $10,099 |
| 2022 | $1,663 | $6,961 | $467 | $6,494 |
| 2021 | $1,640 | $6,960 | $466 | $6,494 |
| 2020 | $1,659 | $6,960 | $466 | $6,494 |
| 2019 | $2,439 | $9,045 | $429 | $8,616 |
| 2018 | $2,398 | $9,045 | $429 | $8,616 |
| 2017 | $2,336 | $9,045 | $429 | $8,616 |
| 2016 | $3,928 | $9,156 | $373 | $8,783 |
| 2015 | $2,740 | $9,156 | $373 | $8,783 |
| 2014 | $2,682 | $9,156 | $373 | $8,783 |
| 2013 | $1,980 | $8,043 | $373 | $7,670 |
Source: Public Records
Map
Nearby Homes
- 14970 Pulaski Rd Unit 5
- 14903 Terrace Ln
- 15035 Harding Ave
- 14837 Karlov Ave
- 15115 Springfield Ave
- 15031 Hamlin Ave
- 4031 147th St
- 15222 Hamlin Ave
- 14618 Keystone Ave
- 14613 Keystone Ave
- 15213 Waverly Ave
- 14547 Keystone Ave Unit 12
- 14539 Crawford Ave
- 3642 147th Place
- 3618 148th St
- 3625 147th St
- 3851 153rd Place
- 14455 Kedvale Ave
- 14301 Hamlin Ave
- 14540 Kolin Ave
- 14960 Pulaski Rd Unit 8
- 14960 Pulaski Rd Unit 3
- 14960 Pulaski Rd Unit 7
- 14960 Pulaski Rd Unit 11
- 14960 Pulaski Rd Unit 4
- 14960 Pulaski Rd Unit 12
- 14960 Pulaski Rd Unit 1A
- 14970 Pulaski Rd Unit 2
- 14970 Pulaski Rd Unit G6
- 14970 Pulaski Rd Unit 10
- 14970 Pulaski Rd Unit 1
- 14970 Pulaski Rd Unit 6
- 14970 Pulaski Rd Unit 10
- 14970 Pulaski Rd Unit 9
- 14970 Pulaski Rd
- 14969 Willowcrest Ct Unit 13
- 14969 Willowcrest Ct Unit G8
- 14969 Willowcrest Ct Unit G3
- 14969 Willowcrest Ct Unit G2
- 14969 Willowcrest Ct Unit 22
Your Personal Tour Guide
Ask me questions while you tour the home.