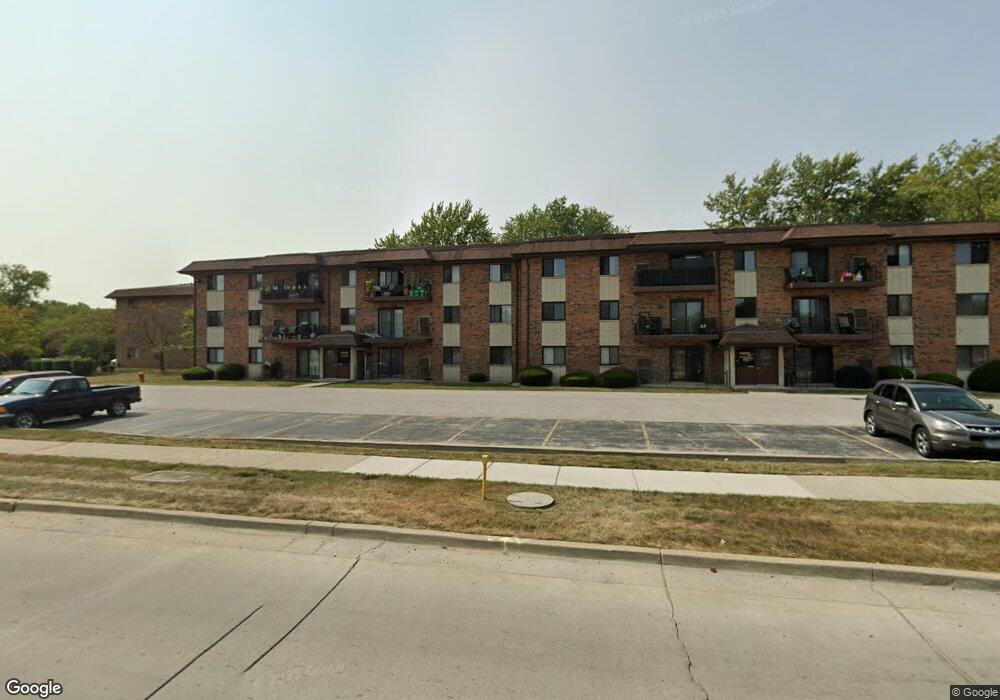
14960 Pulaski Rd Unit 7 Midlothian, IL 60445
Estimated Value: $135,000 - $151,000
2
Beds
2
Baths
1,000
Sq Ft
$145/Sq Ft
Est. Value
About This Home
This home is located at 14960 Pulaski Rd Unit 7, Midlothian, IL 60445 and is currently estimated at $144,595, approximately $144 per square foot. 14960 Pulaski Rd Unit 7 is a home located in Cook County with nearby schools including Springfield Elementary School, Bremen High School, and St. Christopher School.
Ownership History
Date
Name
Owned For
Owner Type
Purchase Details
Closed on
Feb 18, 2005
Sold by
Correa Carmen
Bought by
Bean Cynthia
Current Estimated Value
Home Financials for this Owner
Home Financials are based on the most recent Mortgage that was taken out on this home.
Original Mortgage
$100,000
Outstanding Balance
$49,670
Interest Rate
5.71%
Mortgage Type
Unknown
Estimated Equity
$94,925
Purchase Details
Closed on
Aug 28, 2001
Sold by
Flores Juan A
Bought by
Flores Juan A and Correa Carmen
Purchase Details
Closed on
Jun 13, 2001
Sold by
Armbrecht David S
Bought by
Flores Juan A
Purchase Details
Closed on
Dec 17, 1999
Sold by
Swett Elizabeth
Bought by
Armbrecht David S
Home Financials for this Owner
Home Financials are based on the most recent Mortgage that was taken out on this home.
Original Mortgage
$55,000
Interest Rate
8.13%
Create a Home Valuation Report for This Property
The Home Valuation Report is an in-depth analysis detailing your home's value as well as a comparison with similar homes in the area
Home Values in the Area
Average Home Value in this Area
Purchase History
| Date | Buyer | Sale Price | Title Company |
|---|---|---|---|
| Bean Cynthia | $100,000 | Pntn | |
| Flores Juan A | -- | Pntn | |
| Flores Juan A | $72,000 | Lawyers Title Insurance Corp | |
| Armbrecht David S | -- | -- |
Source: Public Records
Mortgage History
| Date | Status | Borrower | Loan Amount |
|---|---|---|---|
| Open | Bean Cynthia | $100,000 | |
| Previous Owner | Armbrecht David S | $55,000 |
Source: Public Records
Tax History
| Year | Tax Paid | Tax Assessment Tax Assessment Total Assessment is a certain percentage of the fair market value that is determined by local assessors to be the total taxable value of land and additions on the property. | Land | Improvement |
|---|---|---|---|---|
| 2025 | $2,810 | $10,741 | $199 | $10,542 |
| 2024 | $2,810 | $10,741 | $199 | $10,542 |
| 2023 | $448 | $10,741 | $199 | $10,542 |
| 2022 | $448 | $4,374 | $356 | $4,018 |
| 2021 | $471 | $4,373 | $355 | $4,018 |
| 2020 | $547 | $4,373 | $355 | $4,018 |
| 2019 | $1,387 | $5,739 | $327 | $5,412 |
| 2018 | $2,601 | $9,519 | $327 | $9,192 |
| 2017 | $2,531 | $9,519 | $327 | $9,192 |
| 2016 | $3,255 | $10,084 | $284 | $9,800 |
| 2015 | $3,130 | $10,084 | $284 | $9,800 |
| 2014 | $3,060 | $10,084 | $284 | $9,800 |
| 2013 | $2,407 | $9,208 | $284 | $8,924 |
Source: Public Records
Map
Nearby Homes
- 14970 Pulaski Rd Unit 5
- 14903 Terrace Ln
- 15035 Harding Ave
- 14837 Karlov Ave
- 15115 Springfield Ave
- 15031 Hamlin Ave
- 4031 147th St
- 15222 Hamlin Ave
- 14618 Keystone Ave
- 14613 Keystone Ave
- 15213 Waverly Ave
- 14547 Keystone Ave Unit 12
- 14539 Crawford Ave
- 3642 147th Place
- 3618 148th St
- 3625 147th St
- 3851 153rd Place
- 14455 Kedvale Ave
- 14301 Hamlin Ave
- 14540 Kolin Ave
- 14960 Pulaski Rd Unit 8
- 14960 Pulaski Rd Unit 12
- 14960 Pulaski Rd Unit 3
- 14960 Pulaski Rd Unit 11
- 14960 Pulaski Rd Unit 4
- 14960 Pulaski Rd Unit 12
- 14960 Pulaski Rd Unit 1A
- 14970 Pulaski Rd Unit 2
- 14970 Pulaski Rd Unit G6
- 14970 Pulaski Rd Unit 10
- 14970 Pulaski Rd Unit 1
- 14970 Pulaski Rd Unit 6
- 14970 Pulaski Rd Unit 10
- 14970 Pulaski Rd Unit 9
- 14970 Pulaski Rd
- 14969 Willowcrest Ct Unit 13
- 14969 Willowcrest Ct Unit G8
- 14969 Willowcrest Ct Unit G3
- 14969 Willowcrest Ct Unit G2
- 14969 Willowcrest Ct Unit 22
Your Personal Tour Guide
Ask me questions while you tour the home.