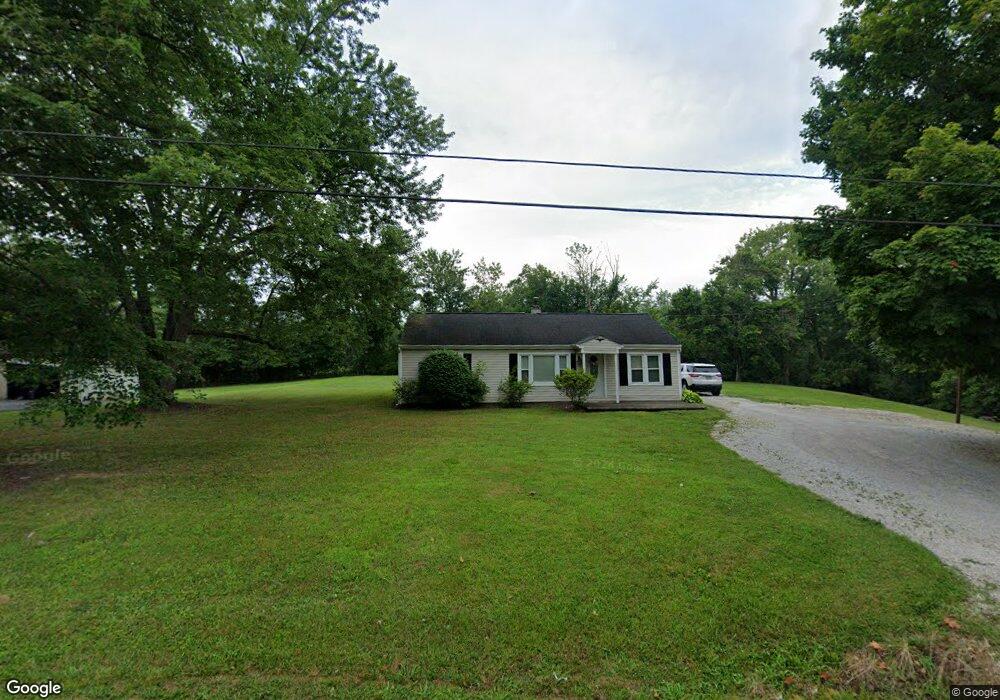
14963 Us Highway 68 Mount Orab, OH 45154
Estimated Value: $184,000 - $216,000
2
Beds
1
Bath
1,722
Sq Ft
$117/Sq Ft
Est. Value
About This Home
This home is located at 14963 Us Highway 68, Mount Orab, OH 45154 and is currently estimated at $201,360, approximately $116 per square foot. 14963 Us Highway 68 is a home located in Brown County with nearby schools including Western Brown High School.
Ownership History
Date
Name
Owned For
Owner Type
Purchase Details
Closed on
Feb 13, 2019
Sold by
Cierley Edward B and Cierley Vicky
Bought by
Campbell Jeffrey S
Current Estimated Value
Home Financials for this Owner
Home Financials are based on the most recent Mortgage that was taken out on this home.
Original Mortgage
$111,111
Outstanding Balance
$97,487
Interest Rate
4.4%
Mortgage Type
New Conventional
Estimated Equity
$103,873
Purchase Details
Closed on
Mar 4, 2011
Sold by
Cierley Edward B and Cierley Vicky
Bought by
Cierley Vicky and Cierley Edward B
Home Financials for this Owner
Home Financials are based on the most recent Mortgage that was taken out on this home.
Original Mortgage
$90,919
Interest Rate
4.85%
Mortgage Type
New Conventional
Purchase Details
Closed on
Dec 6, 2006
Sold by
Wallace Beverly
Bought by
Cierley Edward B and Cierley Vicky
Purchase Details
Closed on
Aug 23, 2005
Sold by
Estate Of Robert F Wallace
Bought by
Wallace Beverly
Create a Home Valuation Report for This Property
The Home Valuation Report is an in-depth analysis detailing your home's value as well as a comparison with similar homes in the area
Home Values in the Area
Average Home Value in this Area
Purchase History
| Date | Buyer | Sale Price | Title Company |
|---|---|---|---|
| Campbell Jeffrey S | $110,000 | Techne Title Agency Inc | |
| Cierley Vicky | -- | Attorney | |
| Cierley Edward B | $105,000 | Attorney | |
| Wallace Beverly | -- | -- |
Source: Public Records
Mortgage History
| Date | Status | Borrower | Loan Amount |
|---|---|---|---|
| Open | Campbell Jeffrey S | $111,111 | |
| Previous Owner | Cierley Vicky | $90,919 |
Source: Public Records
Tax History Compared to Growth
Tax History
| Year | Tax Paid | Tax Assessment Tax Assessment Total Assessment is a certain percentage of the fair market value that is determined by local assessors to be the total taxable value of land and additions on the property. | Land | Improvement |
|---|---|---|---|---|
| 2024 | $803 | $27,970 | $8,520 | $19,450 |
| 2023 | $803 | $21,140 | $5,910 | $15,230 |
| 2022 | $649 | $21,140 | $5,910 | $15,230 |
| 2021 | $640 | $21,140 | $5,910 | $15,230 |
| 2020 | $574 | $18,380 | $5,140 | $13,240 |
| 2019 | $616 | $18,380 | $5,140 | $13,240 |
| 2018 | $612 | $18,380 | $5,140 | $13,240 |
| 2017 | $574 | $17,160 | $5,660 | $11,500 |
| 2016 | $574 | $17,160 | $5,660 | $11,500 |
| 2015 | $571 | $17,160 | $5,660 | $11,500 |
| 2014 | $571 | $16,640 | $5,140 | $11,500 |
| 2013 | $570 | $16,640 | $5,140 | $11,500 |
Source: Public Records
Map
Nearby Homes
- 0 Donley Rd Unit 1859270
- 0 State Route 32 Unit 1795308
- 14663 Day Rd
- 100 Robin Ave
- 204 Katelin Ln
- 0 Bardwell W Unit 1854344
- 15467 Hillcrest Rd
- 3517 Bardwell Buford Rd
- 329 E Main St
- 15503 Crawford-Day Rd
- 15721 Brooks Malott Rd
- 14084 Holiday Dr
- 203 Bingaman Ln
- 125 Sweet Bay Trail
- 105 Maple Ridge Ave
- 0 Valerie Ln Unit 1862359
- 411 Smith Ave
- 108 Lonny St
- 106 Lonny St
- 103 Lonny St
- 14951 Us Highway 68
- 14991 Us Highway 68
- 14991 Us Rt 68
- 14950 Us Highway 68
- 14991 Us-68
- 3859 Bardwell Rd W
- 3859 Bardwell West Rd
- 15000 Us Highway 68
- 14992 Us Highway 68
- 15012 Us Highway 68
- 14906 State Route 68
- 15040 Us Rt 68
- 15041 U S 68
- 15041 U S 68
- 15041 Us Highway 68
- 14890 Us Highway 68
- 11307 Us Route 68
- 13648 Us Route 68
- 14872 Us Route 68
- 14857 Us Highway 68