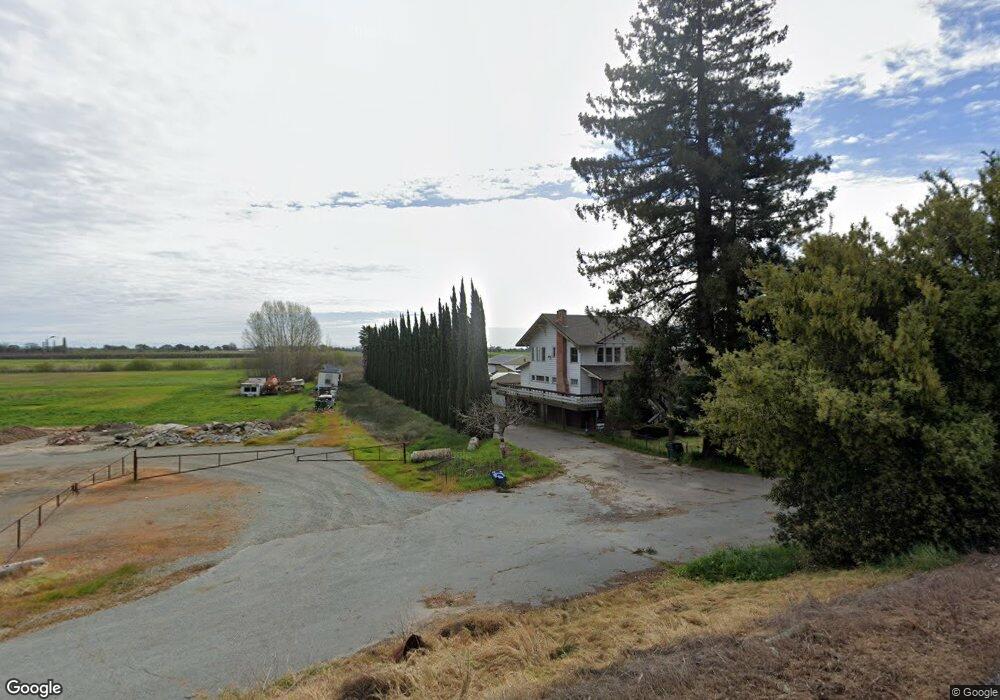
14979 Isleton Rd Isleton, CA 95641
Estimated Value: $1,566,000
5
Beds
4
Baths
4,000
Sq Ft
$392/Sq Ft
Est. Value
About This Home
This home is located at 14979 Isleton Rd, Isleton, CA 95641 and is currently priced at $1,566,000, approximately $391 per square foot. 14979 Isleton Rd is a home located in Sacramento County with nearby schools including Walnut Grove Elementary School, Clarksburg Middle School, and Delta High School.
Ownership History
Date
Name
Owned For
Owner Type
Purchase Details
Closed on
May 28, 2024
Sold by
445 Pine Investments Llc
Bought by
Sharp Kurt Dion
Current Estimated Value
Purchase Details
Closed on
Oct 13, 2023
Sold by
Community West Bank Na
Bought by
445 Pine Investments Llc
Purchase Details
Closed on
Aug 24, 2023
Sold by
Mortgage Lender Services Inc and Sharp Lisa M
Bought by
Community West Bank Na and Sharp
Purchase Details
Closed on
Jul 13, 2017
Sold by
Sharp Kurt D and Sharp Lisa M
Bought by
Sharp Kurt D
Purchase Details
Closed on
Aug 16, 2012
Sold by
Souza Richard T and Souza Mary Barbara
Bought by
Sharp Kurt D and Sharp Lisa M
Home Financials for this Owner
Home Financials are based on the most recent Mortgage that was taken out on this home.
Original Mortgage
$900,000
Interest Rate
3.49%
Mortgage Type
Unknown
Create a Home Valuation Report for This Property
The Home Valuation Report is an in-depth analysis detailing your home's value as well as a comparison with similar homes in the area
Purchase History
| Date | Buyer | Sale Price | Title Company |
|---|---|---|---|
| Sharp Kurt Dion | $631,500 | None Listed On Document | |
| Sharp Kurt Dion | $631,500 | None Listed On Document | |
| 445 Pine Investments Llc | -- | None Listed On Document | |
| Community West Bank Na | $714,013 | None Listed On Document | |
| Sharp Kurt D | -- | None Available | |
| Sharp Kurt D | $900,000 | Pacific Coast Title Company |
Source: Public Records
Mortgage History
| Date | Status | Borrower | Loan Amount |
|---|---|---|---|
| Previous Owner | Sharp Kurt D | $900,000 |
Source: Public Records
Tax History
| Year | Tax Paid | Tax Assessment Tax Assessment Total Assessment is a certain percentage of the fair market value that is determined by local assessors to be the total taxable value of land and additions on the property. | Land | Improvement |
|---|---|---|---|---|
| 2025 | $6,822 | $329,565 | $125,565 | $204,000 |
| 2024 | $6,822 | $329,785 | $129,785 | $200,000 |
| 2023 | $10,635 | $631,093 | $128,596 | $502,497 |
| 2022 | $11,483 | $714,347 | $128,043 | $586,304 |
| 2021 | $10,533 | $627,072 | $122,138 | $504,934 |
| 2020 | $10,221 | $667,462 | $116,582 | $550,880 |
| 2019 | $9,292 | $590,053 | $106,535 | $483,518 |
| 2018 | $12,215 | $533,195 | $103,661 | $429,534 |
| 2017 | $5,411 | $504,811 | $136,524 | $368,287 |
| 2016 | $5,045 | $468,672 | $130,617 | $338,055 |
| 2015 | $5,159 | $473,526 | $121,745 | $351,781 |
| 2014 | $5,457 | $499,332 | $96,540 | $402,792 |
Source: Public Records
Map
Nearby Homes
- 0 W Walker Landing Rd Unit SW25276321
- 0 Andrus Island Rd Unit 23383044
- 15731 Andrus Island Rd
- 19701 Tyler Island Rd
- 0 Halls Island Unit ML82032701
- 14286 State Hwy 160
- 14268 California 160
- 14226 California 160
- 14371 Race Track Rd
- 14144 Market St
- 14132 Market St
- 1332 Corodon St
- 16071 Tyler Island Rd
- 1264 B St
- 14120 Grove St
- 14105 River Rd
- 14071 River Rd
- 14117 Pine St
- 14090 Winnie St
- 14055 River Rd
- 0 W Walker Landing Rd Unit 12007738
- 14434 State Highway 160
- 14434 State Highway 160
- 14400 State Highway 160
- 14400 State Highway 160
- 0 Isleton Rd Unit 16060067
- 0 Isleton Rd Unit 16076834
- 15150 Isleton Rd
- 0 Isleton Rd Unit 19065030
- 0 Andrus Island Rd Unit 18058498
- 14874 Andrus Island Rd
- 14840 Andrus Island Rd
- 264 W Walker Landing Rd
- 14810 Andrus Island Rd
- 14810 Andrus Island Rd Unit 4
- 14810 Andrus Island Rd Unit 8
- 14810 Andrus Island #8 Unit 8
- 14810 Andrus Island Rd Unit 1
- 14486 State Highway 160
- 0 Andrus Island Rd
Your Personal Tour Guide
Ask me questions while you tour the home.