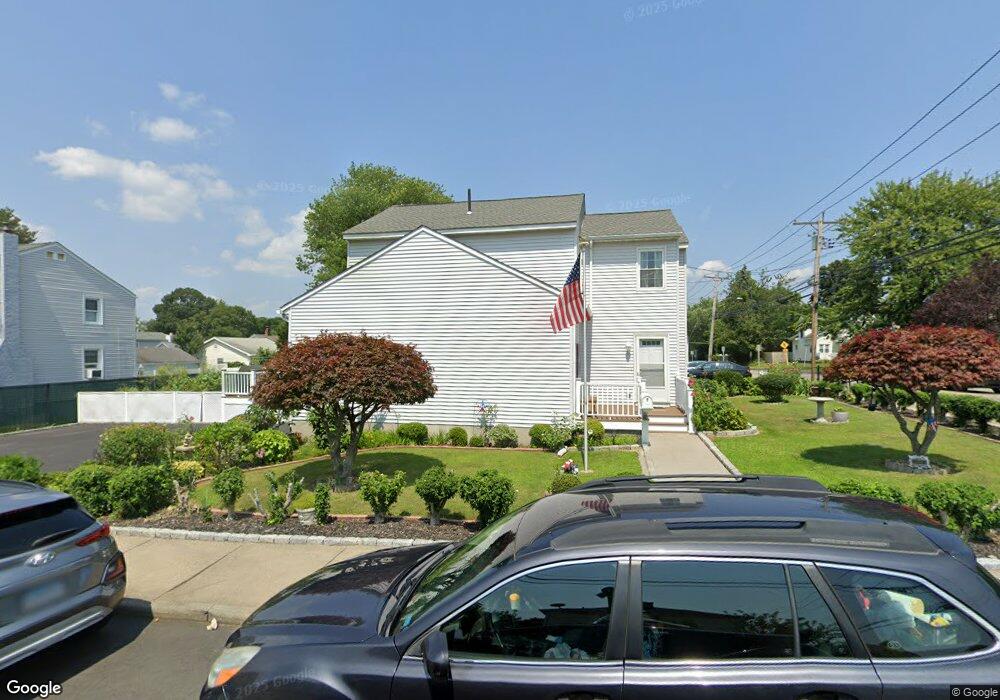
1498 New Haven Ave Milford, CT 06460
Woodmont NeighborhoodEstimated Value: $463,533 - $560,000
3
Beds
2
Baths
1,335
Sq Ft
$379/Sq Ft
Est. Value
About This Home
This home is located at 1498 New Haven Ave, Milford, CT 06460 and is currently estimated at $506,133, approximately $379 per square foot. 1498 New Haven Ave is a home located in New Haven County with nearby schools including Live Oaks School, East Shore Middle School, and Joseph A. Foran High School.
Ownership History
Date
Name
Owned For
Owner Type
Purchase Details
Closed on
Mar 24, 2010
Sold by
Rychilik Lyta
Bought by
Rychilik Lyta and Rychilik Robert J
Current Estimated Value
Purchase Details
Closed on
Aug 9, 1994
Sold by
Darris Dev Inc
Bought by
Pooley Ly Thi
Home Financials for this Owner
Home Financials are based on the most recent Mortgage that was taken out on this home.
Original Mortgage
$111,540
Interest Rate
8.4%
Mortgage Type
Unknown
Create a Home Valuation Report for This Property
The Home Valuation Report is an in-depth analysis detailing your home's value as well as a comparison with similar homes in the area
Home Values in the Area
Average Home Value in this Area
Purchase History
| Date | Buyer | Sale Price | Title Company |
|---|---|---|---|
| Rychilik Lyta | -- | -- | |
| Rychilik Lyta | -- | -- | |
| Pooley Ly Thi | $139,900 | -- | |
| Pooley Ly Thi | $139,900 | -- |
Source: Public Records
Mortgage History
| Date | Status | Borrower | Loan Amount |
|---|---|---|---|
| Previous Owner | Pooley Ly Thi | $114,000 | |
| Previous Owner | Pooley Ly Thi | $109,650 | |
| Previous Owner | Pooley Ly Thi | $111,540 |
Source: Public Records
Tax History Compared to Growth
Tax History
| Year | Tax Paid | Tax Assessment Tax Assessment Total Assessment is a certain percentage of the fair market value that is determined by local assessors to be the total taxable value of land and additions on the property. | Land | Improvement |
|---|---|---|---|---|
| 2025 | $6,613 | $223,800 | $91,480 | $132,320 |
| 2024 | $6,522 | $223,800 | $91,480 | $132,320 |
| 2023 | $6,081 | $223,800 | $91,480 | $132,320 |
| 2022 | $5,964 | $223,800 | $91,480 | $132,320 |
| 2021 | $5,353 | $193,590 | $71,680 | $121,910 |
| 2020 | $5,359 | $193,590 | $71,680 | $121,910 |
| 2019 | $5,364 | $193,590 | $71,680 | $121,910 |
| 2018 | $5,370 | $193,590 | $71,680 | $121,910 |
| 2017 | $5,380 | $193,590 | $71,680 | $121,910 |
| 2016 | $4,946 | $177,660 | $64,510 | $113,150 |
| 2015 | $4,953 | $177,660 | $64,510 | $113,150 |
| 2014 | $4,836 | $177,660 | $64,510 | $113,150 |
Source: Public Records
Map
Nearby Homes