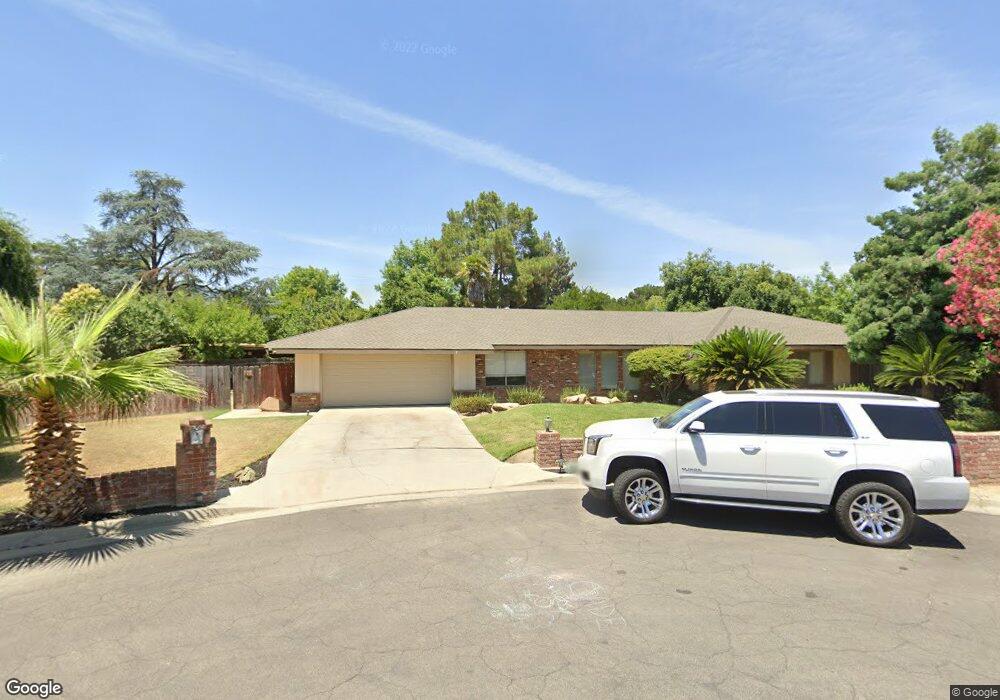
1498 W Stuart Ave Fresno, CA 93711
Bullard NeighborhoodEstimated Value: $548,000 - $586,000
3
Beds
3
Baths
2,492
Sq Ft
$228/Sq Ft
Est. Value
About This Home
This home is located at 1498 W Stuart Ave, Fresno, CA 93711 and is currently estimated at $568,219, approximately $228 per square foot. 1498 W Stuart Ave is a home located in Fresno County with nearby schools including Starr Elementary School, Tenaya Middle School, and Bullard High School.
Ownership History
Date
Name
Owned For
Owner Type
Purchase Details
Closed on
Jul 25, 2017
Sold by
Bennett Patricia C
Bought by
Bennett Patricia C and Patricia Bennett Living Trust
Current Estimated Value
Purchase Details
Closed on
Nov 2, 2009
Sold by
Bennett Hank
Bought by
Bonanza Creek Land Company Llc
Purchase Details
Closed on
Dec 14, 2007
Sold by
Olson David and Olson Kathleen
Bought by
Bennett Hank and The Hank Bennett Living Trust
Purchase Details
Closed on
Jul 5, 2006
Sold by
Bay Business Credit
Bought by
Bennett Hank and Hank Bennett Living Trust
Purchase Details
Closed on
Jan 8, 2002
Sold by
Saulsbury Robert M and Saulsbury Royallyn A
Bought by
Bay Business Credit
Purchase Details
Closed on
May 16, 2001
Sold by
Saulsbury Robert M and Saulsbury Royallyn A
Bought by
Bay Business Credit
Create a Home Valuation Report for This Property
The Home Valuation Report is an in-depth analysis detailing your home's value as well as a comparison with similar homes in the area
Home Values in the Area
Average Home Value in this Area
Purchase History
| Date | Buyer | Sale Price | Title Company |
|---|---|---|---|
| Bennett Patricia C | -- | None Available | |
| Bennett Patricia C | -- | None Available | |
| Bennett Frank H | -- | None Available | |
| Bonanza Creek Land Company Llc | -- | None Available | |
| Bennett Hank | $8,500 | Financial Title Company | |
| Bennett Hank | $345,000 | Financial Title Company | |
| Bay Business Credit | $139,118 | Alliance Title Company | |
| Bay Business Credit | $6,926 | First American Title Ins Co |
Source: Public Records
Tax History Compared to Growth
Tax History
| Year | Tax Paid | Tax Assessment Tax Assessment Total Assessment is a certain percentage of the fair market value that is determined by local assessors to be the total taxable value of land and additions on the property. | Land | Improvement |
|---|---|---|---|---|
| 2025 | $4,478 | $367,872 | $77,442 | $290,430 |
| 2023 | $4,392 | $353,589 | $74,436 | $279,153 |
| 2022 | $4,333 | $346,657 | $72,977 | $273,680 |
| 2021 | $4,213 | $339,861 | $71,547 | $268,314 |
| 2020 | $4,195 | $336,377 | $70,814 | $265,563 |
| 2019 | $4,032 | $329,782 | $69,426 | $260,356 |
| 2018 | $3,944 | $323,316 | $68,065 | $255,251 |
| 2017 | $3,876 | $316,978 | $66,731 | $250,247 |
| 2016 | $3,746 | $310,764 | $65,423 | $245,341 |
| 2015 | $3,689 | $306,097 | $64,441 | $241,656 |
| 2014 | $3,618 | $300,102 | $63,179 | $236,923 |
Source: Public Records
Map
Nearby Homes
- 1387 W Sample Ave
- 1590 W Escalon Ave
- 1611 W Escalon Ave
- 1545 W Calimyrna Ave
- 1654 W Vartikian Ave
- 1232 W Mesa Ave
- 1229 W Bullard Ave Unit 105
- 1702 W Bullard Ave Unit 105
- 1709 W Calimyrna Ave Unit 9A
- 1486 W Roberts Ave
- 6447 N Vagedes Ave
- 2015 W Calimyrna Ave Unit 1A
- 5740 N West Ave Unit 109
- 5740 N West Ave Unit 107
- 5610 N Arthur Ave
- 2076 W Calimyrna Ave Unit 102
- 2073 W Calimyrna Ave Unit 101
- 6569 N Teilman Ave
- 1041 W Sierra Ave
- 5630 N El Adobe Dr
- 1516 W Escalon Ave
- 1480 W Stuart Ave
- 6190 N Delno Ave
- 1497 W Stuart Ave
- 1481 W Escalon Ave
- 6185 N Delno Ave
- 1511 W Escalon Ave
- 1534 W Escalon Ave
- 1462 W Stuart Ave
- 1479 W Stuart Ave
- 1463 W Escalon Ave
- 1461 W Stuart Ave
- 1525 W Escalon Ave
- 6204 N Delno Ave
- 1446 W Stuart Ave
- 1496 W Mesa Ave
- 1546 W Escalon Ave
- 1478 W Mesa Ave
- 1512 W Mesa Ave
- 1476 W Escalon Ave