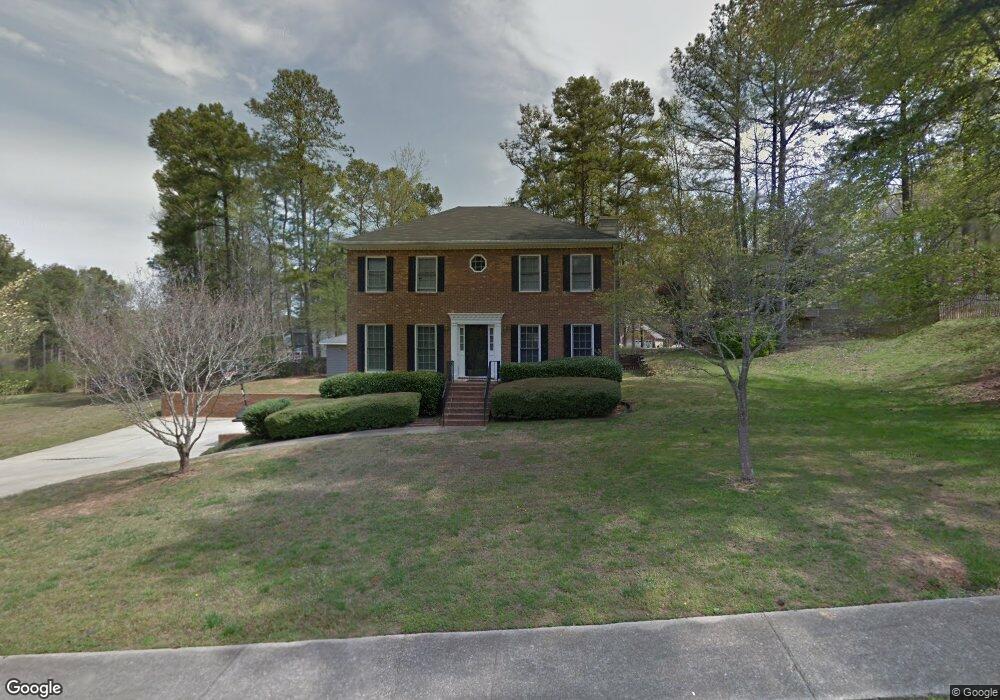
1499 Mill Creek Ct Sw Millc Marietta, GA 30008
Southwestern Marietta NeighborhoodEstimated Value: $384,000 - $413,539
3
Beds
4
Baths
1,910
Sq Ft
$209/Sq Ft
Est. Value
About This Home
This home is located at 1499 Mill Creek Ct Sw Millc, Marietta, GA 30008 and is currently estimated at $399,135, approximately $208 per square foot. 1499 Mill Creek Ct Sw Millc is a home located in Cobb County with nearby schools including Birney Elementary School, Smitha Middle School, and Osborne High School.
Ownership History
Date
Name
Owned For
Owner Type
Purchase Details
Closed on
Feb 5, 2021
Sold by
Anderson Brianna and Anderson Joseph
Bought by
Johnson Brian
Current Estimated Value
Home Financials for this Owner
Home Financials are based on the most recent Mortgage that was taken out on this home.
Original Mortgage
$270,750
Outstanding Balance
$241,176
Interest Rate
2.6%
Mortgage Type
New Conventional
Estimated Equity
$157,959
Purchase Details
Closed on
Apr 13, 2020
Sold by
Wilson Brenda C
Bought by
Anderson Brianna and Anderson Joseph
Home Financials for this Owner
Home Financials are based on the most recent Mortgage that was taken out on this home.
Original Mortgage
$257,050
Interest Rate
3.4%
Mortgage Type
New Conventional
Purchase Details
Closed on
Jan 26, 2005
Sold by
Singh Teja and Singh Esther
Bought by
Wilson Louis H and Wilson Brenda
Create a Home Valuation Report for This Property
The Home Valuation Report is an in-depth analysis detailing your home's value as well as a comparison with similar homes in the area
Home Values in the Area
Average Home Value in this Area
Purchase History
| Date | Buyer | Sale Price | Title Company |
|---|---|---|---|
| Johnson Brian | $285,000 | None Available | |
| Anderson Brianna | $265,000 | None Available | |
| Wilson Louis H | $160,000 | -- |
Source: Public Records
Mortgage History
| Date | Status | Borrower | Loan Amount |
|---|---|---|---|
| Open | Johnson Brian | $270,750 | |
| Previous Owner | Anderson Brianna | $257,050 |
Source: Public Records
Tax History Compared to Growth
Tax History
| Year | Tax Paid | Tax Assessment Tax Assessment Total Assessment is a certain percentage of the fair market value that is determined by local assessors to be the total taxable value of land and additions on the property. | Land | Improvement |
|---|---|---|---|---|
| 2025 | $3,858 | $151,816 | $35,200 | $116,616 |
| 2024 | $3,861 | $151,816 | $35,200 | $116,616 |
| 2023 | $3,148 | $143,940 | $10,000 | $133,940 |
| 2022 | $3,062 | $114,000 | $9,480 | $104,520 |
| 2021 | $3,013 | $99,288 | $10,000 | $89,288 |
| 2020 | $2,628 | $86,604 | $10,000 | $76,604 |
| 2019 | $2,362 | $77,840 | $10,000 | $67,840 |
| 2018 | $2,362 | $77,840 | $10,000 | $67,840 |
| 2017 | $1,648 | $57,328 | $10,000 | $47,328 |
| 2016 | $1,648 | $57,328 | $10,000 | $47,328 |
| 2015 | $1,468 | $49,836 | $8,000 | $41,836 |
| 2014 | $1,481 | $49,836 | $0 | $0 |
Source: Public Records
Map
Nearby Homes
- 3075 Milford Chase SW
- 3123 Milford Chase SW
- 1427 Lost Bridge Rd
- 1308 Willamette Way
- 2964 Edgemont Ln SW
- 3055 Milford Chase Overlook SW
- 1345 Windage Ct SW Unit 6
- 1086 Mornington Way
- 3004 Michael Dr SW
- 2700 Flintlock Ln SW
- 1719 Silverchase Dr SW
- 1559 Woodmore Dr SW
- 2615 Windage Dr SW
- 1697 Rustic Dr SW
- 1618 Sparrow Wood Ln SW
- 1613 Sparrow Wood Ln SW Unit 3
- 3340 Vineland Dr SW
- 1104 Havel Dr SW
- 1499 Mill Creek Ct SW
- 0 Mill Creek Ct SW Unit 3247580
- 0 Mill Creek Ct SW Unit 8866943
- 0 Mill Creek Ct SW Unit 8451158
- 0 Mill Creek Ct SW Unit 8200076
- 0 Mill Creek Ct SW Unit 7629640
- 1497 Mill Creek Ct SW
- 2862 Creek Ct SW
- 1498 Mill Creek Ct SW
- 2858 Creek Ct SW
- 0 Creek Ct SW Unit 8918809
- 0 Creek Ct SW
- 1501 Mill Creek Ct SW
- 1500 Mill Creek Ct SW
- 1491 Mill Creek Ct SW
- 1496 Mill Creek Ct SW Unit 2
- 1502 Mill Creek Ct SW
- 1503 Mill Creek Ct SW Unit 2
- 2861 Creek Ct SW Unit 2
- 1494 Mill Creek Ct SW