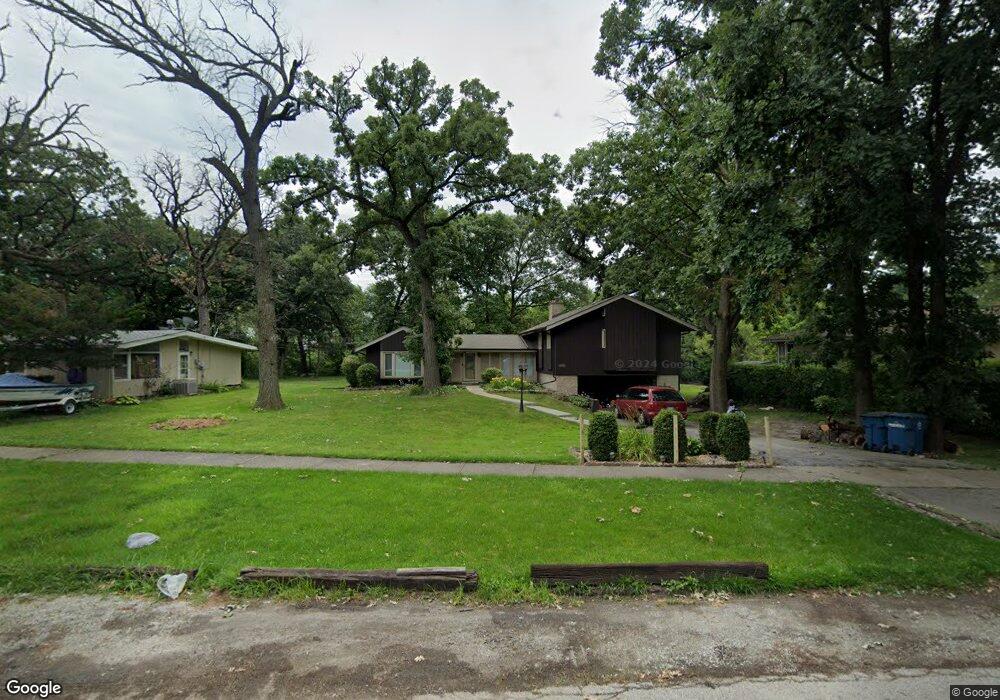
14990 Markham Dr Harvey, IL 60426
Estimated Value: $146,000 - $224,000
4
Beds
2
Baths
1,472
Sq Ft
$121/Sq Ft
Est. Value
About This Home
This home is located at 14990 Markham Dr, Harvey, IL 60426 and is currently estimated at $178,100, approximately $120 per square foot. 14990 Markham Dr is a home located in Cook County with nearby schools including Park Elementary School, Roosevelt Junior High School, and Thornton Township High School.
Ownership History
Date
Name
Owned For
Owner Type
Purchase Details
Closed on
Oct 18, 2007
Sold by
Wright Nicholas D
Bought by
Willis Homer W and Willis Betty J
Current Estimated Value
Home Financials for this Owner
Home Financials are based on the most recent Mortgage that was taken out on this home.
Original Mortgage
$169,100
Outstanding Balance
$104,751
Interest Rate
6.33%
Mortgage Type
Unknown
Estimated Equity
$73,349
Purchase Details
Closed on
Nov 15, 2004
Sold by
Bridgeview Bank Group
Bought by
Wright Nicholas D
Home Financials for this Owner
Home Financials are based on the most recent Mortgage that was taken out on this home.
Original Mortgage
$128,250
Interest Rate
5.71%
Mortgage Type
Unknown
Purchase Details
Closed on
Mar 9, 2004
Sold by
Mccauley Brewster L
Bought by
Bridgeview Bank Trust and Trust Agreement #1-3037
Create a Home Valuation Report for This Property
The Home Valuation Report is an in-depth analysis detailing your home's value as well as a comparison with similar homes in the area
Home Values in the Area
Average Home Value in this Area
Purchase History
| Date | Buyer | Sale Price | Title Company |
|---|---|---|---|
| Willis Homer W | $178,000 | Pntn | |
| Willis Homer W | $178,000 | Pntn | |
| Wright Nicholas D | $101,500 | Lawyers Title Insurance Corp | |
| Wright Nicholas D | $101,500 | Lawyers Title Insurance Corp | |
| Bridgeview Bank Trust | $71,000 | -- | |
| Bridgeview Bank Trust | $71,000 | -- |
Source: Public Records
Mortgage History
| Date | Status | Borrower | Loan Amount |
|---|---|---|---|
| Open | Willis Homer W | $169,100 | |
| Previous Owner | Wright Nicholas D | $128,250 |
Source: Public Records
Tax History
| Year | Tax Paid | Tax Assessment Tax Assessment Total Assessment is a certain percentage of the fair market value that is determined by local assessors to be the total taxable value of land and additions on the property. | Land | Improvement |
|---|---|---|---|---|
| 2025 | $1,368 | $4,729 | $2,958 | $1,771 |
| 2024 | $1,368 | $4,729 | $2,958 | $1,771 |
| 2023 | $1,465 | $4,729 | $2,958 | $1,771 |
| 2022 | $1,465 | $4,909 | $2,958 | $1,951 |
| 2021 | $3,146 | $4,908 | $2,958 | $1,950 |
| 2020 | $3,134 | $4,908 | $2,958 | $1,950 |
| 2019 | $2,527 | $4,388 | $2,761 | $1,627 |
| 2018 | $2,425 | $4,388 | $2,761 | $1,627 |
| 2017 | $2,370 | $4,388 | $2,761 | $1,627 |
| 2016 | $2,954 | $4,879 | $2,563 | $2,316 |
| 2015 | $2,787 | $4,879 | $2,563 | $2,316 |
| 2014 | $2,800 | $4,879 | $2,563 | $2,316 |
| 2013 | $2,904 | $5,394 | $2,563 | $2,831 |
Source: Public Records
Map
Nearby Homes
- 14921 Oakdale Ave
- 565 E 149th St
- 523 E 149th St
- 14955 Riverside Dr
- 15285 State St
- 15245 State St
- 14951 Riverside Dr
- 15025 Riverside Dr
- 910 E 152nd Place
- 15444 State St
- 14908 Riverside Dr
- 14717 E Riverside Dr
- 15046 Perry Ave
- 14727 Riverside Dr
- 15061 Wabash Ave
- 14918 Wabash Ave
- 718 E 152nd St
- 14916 La Salle St
- 14914 Edbrooke Ave
- 14924 Indiana Ave
- 14990 Markham Dr
- 14994 Markham Dr
- 14994 Markham Dr
- 14998 Markham Dr
- 14998 Markham Dr
- 14986 Markham Dr
- 14986 Markham Dr
- 14976 Markham Dr
- 14976 Markham Dr
- 14935 Oakdale Ave
- 14934 E Riverside Dr
- 14930 E Riverside Dr
- 14931 Oakdale Ave
- 14927 Oakdale Ave
- 14938 Oakdale Ave
- 14924 E Riverside Dr
- 14925 Oakdale Ave
- 14970 Markham Dr
- 14970 Markham Dr
- 14924 E Riverside Dr
Your Personal Tour Guide
Ask me questions while you tour the home.