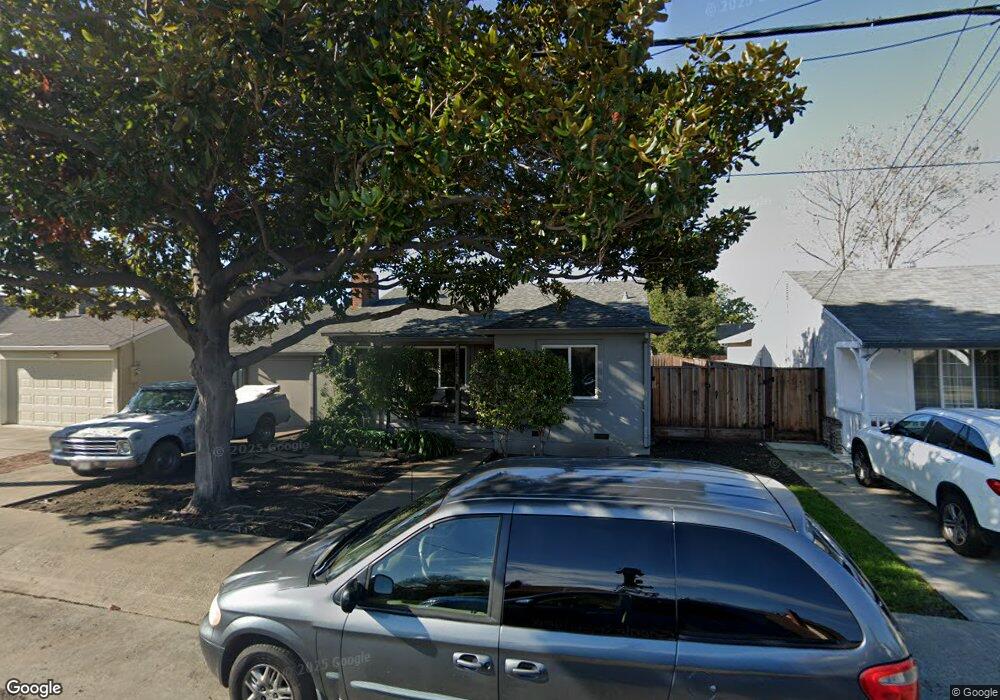
14993 Endicott St San Leandro, CA 94579
Washington Manor-Bonaire NeighborhoodEstimated Value: $874,000 - $952,000
3
Beds
2
Baths
1,730
Sq Ft
$521/Sq Ft
Est. Value
About This Home
This home is located at 14993 Endicott St, San Leandro, CA 94579 and is currently estimated at $902,048, approximately $521 per square foot. 14993 Endicott St is a home located in Alameda County with nearby schools including Dayton Elementary School, Washington Manor Middle School, and Arroyo High School.
Ownership History
Date
Name
Owned For
Owner Type
Purchase Details
Closed on
Feb 4, 2017
Sold by
Clark Mary Schmidt and Clark Michael J
Bought by
Clark Mary Schmidt and Clark Michael Joseph
Current Estimated Value
Purchase Details
Closed on
Apr 21, 2015
Sold by
Schmidt Clark Michael I and Schmidt Clark Mary
Bought by
Clark Mary Schmidt and Clark Michael J
Home Financials for this Owner
Home Financials are based on the most recent Mortgage that was taken out on this home.
Original Mortgage
$250,000
Outstanding Balance
$192,385
Interest Rate
3.73%
Mortgage Type
New Conventional
Estimated Equity
$709,663
Purchase Details
Closed on
Jul 22, 1996
Sold by
Desanti Michael V and Brown Pamela
Bought by
Schmidt Clark Michael J and Schmidt Clark Mary
Home Financials for this Owner
Home Financials are based on the most recent Mortgage that was taken out on this home.
Original Mortgage
$140,650
Interest Rate
8.32%
Create a Home Valuation Report for This Property
The Home Valuation Report is an in-depth analysis detailing your home's value as well as a comparison with similar homes in the area
Home Values in the Area
Average Home Value in this Area
Purchase History
| Date | Buyer | Sale Price | Title Company |
|---|---|---|---|
| Clark Mary Schmidt | -- | None Available | |
| Clark Mary Schmidt | -- | Old Republic Title Company | |
| Schmidt Clark Michael J | $145,000 | North American Title Co |
Source: Public Records
Mortgage History
| Date | Status | Borrower | Loan Amount |
|---|---|---|---|
| Open | Clark Mary Schmidt | $250,000 | |
| Closed | Schmidt Clark Michael J | $140,650 |
Source: Public Records
Tax History
| Year | Tax Paid | Tax Assessment Tax Assessment Total Assessment is a certain percentage of the fair market value that is determined by local assessors to be the total taxable value of land and additions on the property. | Land | Improvement |
|---|---|---|---|---|
| 2025 | $4,961 | $369,224 | $70,843 | $305,381 |
| 2024 | $4,961 | $361,848 | $69,454 | $299,394 |
| 2023 | $4,945 | $361,617 | $68,093 | $293,524 |
| 2022 | $4,864 | $347,528 | $66,758 | $287,770 |
| 2021 | $4,725 | $340,577 | $65,449 | $282,128 |
| 2020 | $4,615 | $344,014 | $64,778 | $279,236 |
| 2019 | $4,615 | $337,271 | $63,508 | $273,763 |
| 2018 | $4,331 | $330,659 | $62,263 | $268,396 |
| 2017 | $4,131 | $324,176 | $61,043 | $263,133 |
| 2016 | $2,686 | $199,487 | $59,846 | $139,641 |
| 2015 | $2,624 | $196,491 | $58,947 | $137,544 |
| 2014 | $2,583 | $192,643 | $57,793 | $134,850 |
Source: Public Records
Map
Nearby Homes
- 15016 Fleming St
- 15040 Fleming St
- 15018 Edgemoor St
- 15106 Edgemoor St
- 391 Anza Way
- 720 Fargo Ave Unit 14
- 690 Fargo Ave Unit 16
- 670 Fargo Ave Unit 5
- 1250 Hubbard Ave
- 1343 Fargo Ave
- 872 Via Bregani
- 3601 Figueroa Dr
- 1078 Via Enrico
- 15274 Laverne Dr
- 15263 Hesperian Blvd Unit 13
- 475 Nabor St
- 15239 Laverne Ct
- 1540 Sayre St
- 527 Colby St
- 157 Santa Teresa
- 14989 Endicott St
- 14997 Endicott St
- 14994 Norton St
- 14985 Endicott St
- 14990 Norton St
- 14998 Norton St
- 14986 Norton St
- 14992 Endicott St
- 14988 Endicott St
- 14996 Endicott St
- 14981 Endicott St
- 820 Manor Blvd
- 14984 Endicott St
- 840 Manor Blvd
- 14982 Norton St
- 14977 Endicott St
- 14980 Endicott St
- 15004 Endicott St
- 15013 Endicott St
- 14978 Norton St
Your Personal Tour Guide
Ask me questions while you tour the home.