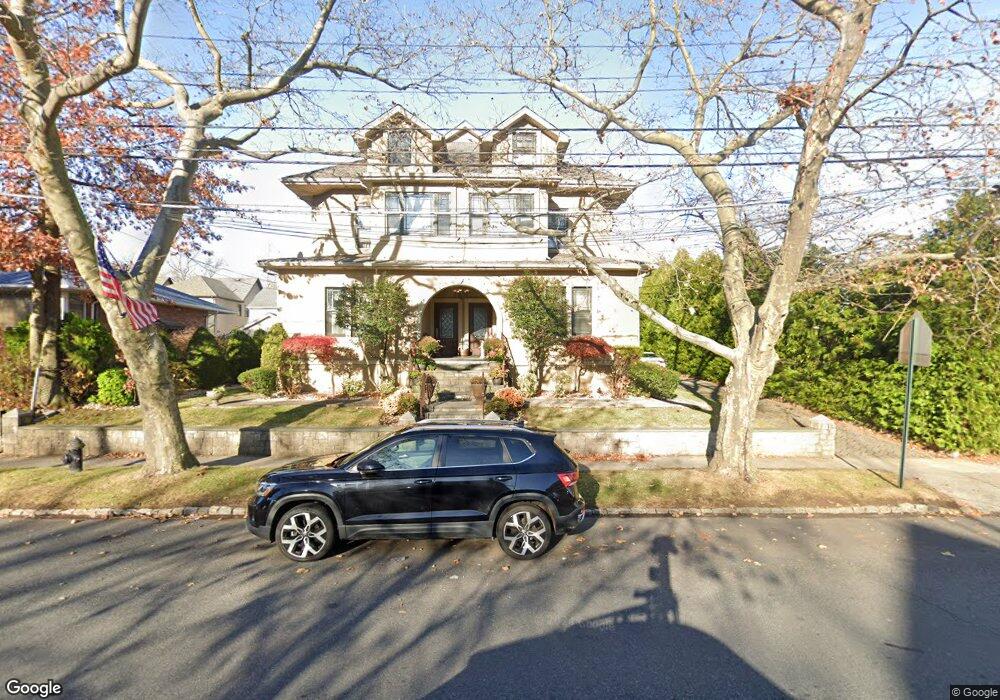
15-17 10th St Staten Island, NY 10306
New Dorp NeighborhoodEstimated Value: $1,087,000 - $1,615,000
--
Bed
--
Bath
3,800
Sq Ft
$359/Sq Ft
Est. Value
About This Home
This home is located at 15-17 10th St, Staten Island, NY 10306 and is currently estimated at $1,365,333, approximately $359 per square foot. 15-17 10th St is a home located in Richmond County with nearby schools including P.S. 41 The Stephanie a Vierno School, Is 2 George L Egbert, and New Dorp High School.
Ownership History
Date
Name
Owned For
Owner Type
Purchase Details
Closed on
Oct 7, 2025
Sold by
Racioppo Lori
Bought by
Peterson Michael and Peterson Gloria
Current Estimated Value
Purchase Details
Closed on
Sep 8, 2025
Sold by
Peterson Tony
Bought by
Peterson Michael and Peterson Gloria
Purchase Details
Closed on
Sep 2, 2025
Sold by
Peterson Michael
Bought by
Peterson Michael and Peterson Gloria
Purchase Details
Closed on
Jun 17, 2016
Sold by
Conte Louis
Bought by
Peterson Michael and Peterson Gloria
Purchase Details
Closed on
Apr 11, 2012
Sold by
Pate John and Pate Robert
Bought by
Peterson Michael and Peterson Gloria
Create a Home Valuation Report for This Property
The Home Valuation Report is an in-depth analysis detailing your home's value as well as a comparison with similar homes in the area
Home Values in the Area
Average Home Value in this Area
Purchase History
| Date | Buyer | Sale Price | Title Company |
|---|---|---|---|
| Peterson Michael | -- | Stewart Title Insurance Compan | |
| Peterson Michael | $12,000 | Stewart Title | |
| Peterson Michael | -- | Stewart Title Insurance Compan | |
| Peterson Michael | -- | None Available | |
| Peterson Michael | -- | None Available |
Source: Public Records
Tax History Compared to Growth
Tax History
| Year | Tax Paid | Tax Assessment Tax Assessment Total Assessment is a certain percentage of the fair market value that is determined by local assessors to be the total taxable value of land and additions on the property. | Land | Improvement |
|---|---|---|---|---|
| 2025 | $10,074 | $97,680 | $8,090 | $89,590 |
| 2024 | $10,086 | $79,800 | $9,342 | $70,458 |
| 2023 | $10,186 | $51,556 | $10,028 | $41,528 |
| 2022 | $9,927 | $60,480 | $14,460 | $46,020 |
| 2021 | $9,856 | $62,160 | $14,460 | $47,700 |
| 2020 | $9,344 | $67,680 | $14,460 | $53,220 |
| 2019 | $8,695 | $58,800 | $14,460 | $44,340 |
| 2018 | $8,460 | $42,963 | $9,253 | $33,710 |
| 2017 | $8,392 | $42,639 | $11,169 | $31,470 |
| 2016 | $7,732 | $40,227 | $13,989 | $26,238 |
| 2015 | -- | $37,951 | $9,907 | $28,044 |
| 2014 | -- | $35,803 | $11,209 | $24,594 |
Source: Public Records
Map
Nearby Homes