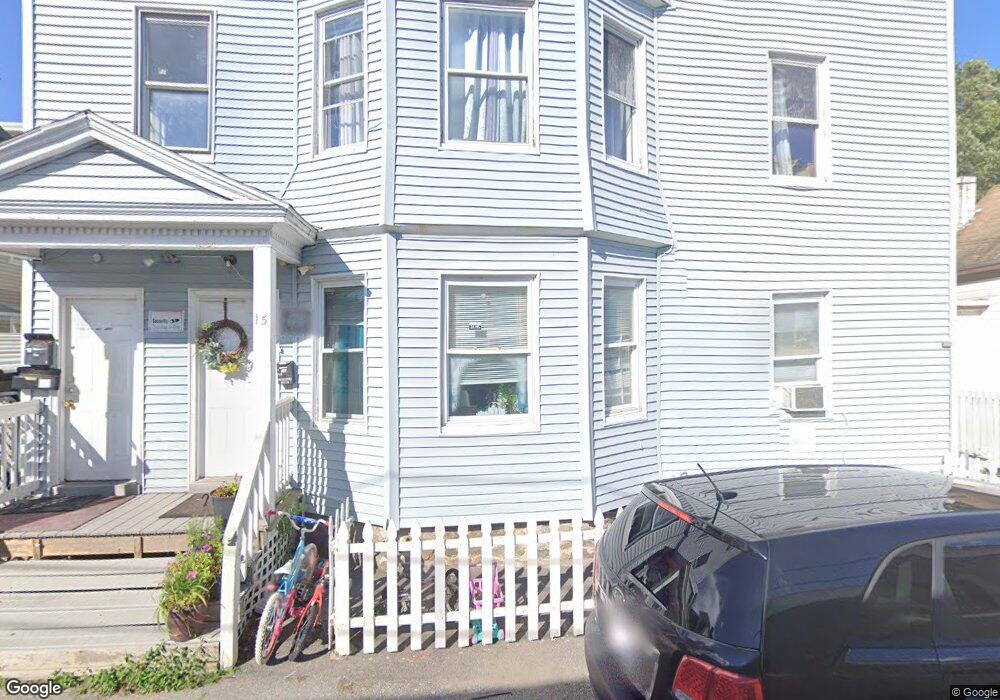
15-17 Merrimack View Ct Lawrence, MA 01841
Tower Hill NeighborhoodEstimated Value: $711,000 - $945,000
7
Beds
3
Baths
3,360
Sq Ft
$246/Sq Ft
Est. Value
About This Home
This home is located at 15-17 Merrimack View Ct, Lawrence, MA 01841 and is currently estimated at $825,000, approximately $245 per square foot. 15-17 Merrimack View Ct is a home located in Essex County with nearby schools including Olive Branch Elementary School, Gerard A. Guilmette School, and School For Exceptional Studies.
Ownership History
Date
Name
Owned For
Owner Type
Purchase Details
Closed on
May 11, 2010
Sold by
Rodriguez Solennidad M
Bought by
Rodriguez Solennidad M and Rodriguez Rene A
Current Estimated Value
Purchase Details
Closed on
Oct 30, 2009
Sold by
Pena Anglea
Bought by
Rodriguez Solennidad M
Home Financials for this Owner
Home Financials are based on the most recent Mortgage that was taken out on this home.
Original Mortgage
$117,826
Interest Rate
5.06%
Mortgage Type
Purchase Money Mortgage
Purchase Details
Closed on
Jul 27, 2005
Sold by
Cabrera Germania
Bought by
Pena Angela
Home Financials for this Owner
Home Financials are based on the most recent Mortgage that was taken out on this home.
Original Mortgage
$224,000
Interest Rate
5.67%
Mortgage Type
Purchase Money Mortgage
Create a Home Valuation Report for This Property
The Home Valuation Report is an in-depth analysis detailing your home's value as well as a comparison with similar homes in the area
Home Values in the Area
Average Home Value in this Area
Purchase History
| Date | Buyer | Sale Price | Title Company |
|---|---|---|---|
| Rodriguez Solennidad M | -- | -- | |
| Rodriguez Solennidad M | $120,000 | -- | |
| Pena Angela | $280,000 | -- |
Source: Public Records
Mortgage History
| Date | Status | Borrower | Loan Amount |
|---|---|---|---|
| Previous Owner | Rodriguez Solennidad M | $117,826 | |
| Previous Owner | Pena Angela | $224,000 |
Source: Public Records
Tax History Compared to Growth
Tax History
| Year | Tax Paid | Tax Assessment Tax Assessment Total Assessment is a certain percentage of the fair market value that is determined by local assessors to be the total taxable value of land and additions on the property. | Land | Improvement |
|---|---|---|---|---|
| 2025 | $5,470 | $621,600 | $86,400 | $535,200 |
| 2024 | $5,144 | $556,100 | $90,800 | $465,300 |
| 2023 | $5,273 | $519,000 | $87,700 | $431,300 |
| 2022 | $4,957 | $433,300 | $82,600 | $350,700 |
| 2021 | $4,697 | $382,800 | $82,600 | $300,200 |
| 2020 | $4,362 | $350,900 | $68,900 | $282,000 |
| 2019 | $4,182 | $305,700 | $51,200 | $254,500 |
| 2018 | $4,090 | $285,600 | $46,400 | $239,200 |
| 2017 | $3,814 | $248,600 | $44,000 | $204,600 |
| 2016 | $3,572 | $230,300 | $34,300 | $196,000 |
| 2015 | $3,205 | $212,000 | $34,300 | $177,700 |
Source: Public Records
Map
Nearby Homes
- 12 Merrimack View Ct
- 55-59 Water St
- 95 Hancock St
- 312 Water St Unit 36
- 82 Water St
- 45 Bodwell St
- 41 Durham St
- 13 Kingston St
- 30-32 Linden St
- 91-93 Newton St
- 82 S Broadway
- 1008 Essex St Unit 1010
- 8 Packard St
- 18 Ames St
- 37 Tewksbury St Unit 39
- 70 Butler St
- 44-46 Butler St
- 62-66 Butler St
- 132-134 S Broadway
- 629 Andover St
- 1-3-5 Merrimack View Ct
- 6 Merrimack View Ct
- 2-4 Merrimack View Ct
- 4 Riverview Place
- 4 Riverview Place
- 9 Merrimack View Ct
- 2 Riverview Place
- 8 Merrimack View Ct
- 8-10 Merrimack View Ct
- 10 Riverview Place
- 2-6-8-10 Merrimack View Ct
- 14 Riverview Place
- 12 Riverview Place
- 12 Riverview Place Unit B
- 15 Merrimack View Ct
- 15 Merrimack View Ct Unit 17
- 1 Riverview Place
- 9 Riverview Place
- 9 Riverview Place Unit 15
- 176-178 Water St