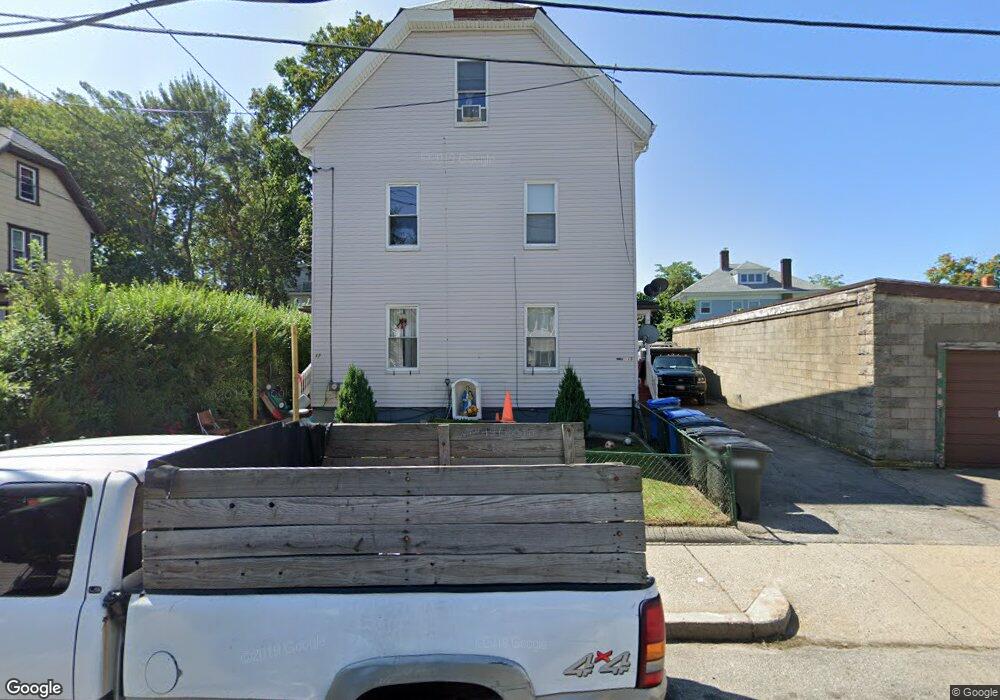
15-17 Myrtle St Waltham, MA 02453
South Side NeighborhoodEstimated Value: $973,306 - $1,112,000
6
Beds
2
Baths
2,000
Sq Ft
$520/Sq Ft
Est. Value
About This Home
This home is located at 15-17 Myrtle St, Waltham, MA 02453 and is currently estimated at $1,040,577, approximately $520 per square foot. 15-17 Myrtle St is a home located in Middlesex County with nearby schools including Henry Whittemore Elementary School, John W. Mcdevitt Middle School, and Waltham Sr High School.
Ownership History
Date
Name
Owned For
Owner Type
Purchase Details
Closed on
May 14, 2021
Sold by
Valenzuela William A and Callejas-Najarro Maura
Bought by
Peterson Sara and Childs Joseph
Current Estimated Value
Home Financials for this Owner
Home Financials are based on the most recent Mortgage that was taken out on this home.
Original Mortgage
$726,596
Outstanding Balance
$658,477
Interest Rate
3.1%
Mortgage Type
FHA
Estimated Equity
$382,100
Purchase Details
Closed on
Feb 9, 2011
Sold by
Valenzuela William A and Callejas Gladis
Bought by
Valenzuela William A
Purchase Details
Closed on
Nov 5, 2009
Sold by
Marrero Rafael-Torres Dejesus J and Marrero Margarita-Ramire
Bought by
Valenzuela William A
Home Financials for this Owner
Home Financials are based on the most recent Mortgage that was taken out on this home.
Original Mortgage
$269,500
Interest Rate
5.06%
Mortgage Type
Purchase Money Mortgage
Purchase Details
Closed on
Jul 27, 1998
Sold by
Alagna Frances Est
Bought by
Dejesus Jose R
Create a Home Valuation Report for This Property
The Home Valuation Report is an in-depth analysis detailing your home's value as well as a comparison with similar homes in the area
Home Values in the Area
Average Home Value in this Area
Purchase History
| Date | Buyer | Sale Price | Title Company |
|---|---|---|---|
| Peterson Sara | $740,000 | None Available | |
| Valenzuela William A | -- | -- | |
| Valenzuela William A | $350,000 | -- | |
| Dejesus Jose R | $192,500 | -- |
Source: Public Records
Mortgage History
| Date | Status | Borrower | Loan Amount |
|---|---|---|---|
| Open | Peterson Sara | $726,596 | |
| Previous Owner | Valenzuela William A | $269,500 | |
| Previous Owner | Dejesus Jose R | $70,000 |
Source: Public Records
Tax History Compared to Growth
Tax History
| Year | Tax Paid | Tax Assessment Tax Assessment Total Assessment is a certain percentage of the fair market value that is determined by local assessors to be the total taxable value of land and additions on the property. | Land | Improvement |
|---|---|---|---|---|
| 2025 | $7,601 | $774,000 | $349,700 | $424,300 |
| 2024 | $7,053 | $731,600 | $349,700 | $381,900 |
| 2023 | $7,077 | $685,800 | $318,600 | $367,200 |
| 2022 | $7,439 | $667,800 | $290,900 | $376,900 |
| 2021 | $6,980 | $616,600 | $263,200 | $353,400 |
| 2020 | $6,907 | $578,000 | $249,300 | $328,700 |
| 2019 | $6,515 | $514,600 | $246,800 | $267,800 |
| 2018 | $5,885 | $466,700 | $228,500 | $238,200 |
| 2017 | $5,602 | $446,000 | $207,800 | $238,200 |
| 2016 | $5,162 | $421,700 | $183,500 | $238,200 |
| 2015 | $4,951 | $377,100 | $180,100 | $197,000 |
Source: Public Records
Map
Nearby Homes
- 15 Alder St Unit 1
- 47 Alder St Unit 6
- 42 Alder St
- 81 Alder St
- 31-37 Washington Ave
- 73 Orange St Unit 2
- 61 Hall St Unit 1
- 61 Hall St Unit 9
- 61 Hall St Unit 2
- 61 Hall St Unit 7
- 24 Tolman St Unit A
- 13 Robbins St Unit 1
- 11 Derby St
- 312 Newton St Unit 1A
- 138 Myrtle St Unit 2
- 308 Newton St Unit 1
- 85 Crescent St
- 55-57 Crescent St
- 74 Rumford Ave
- 28-32 Calvary St
- 15 Myrtle St Unit 17
- 11 Myrtle St
- 23 Myrtle St
- 124 Ash St Unit 126
- 118 Ash St
- 118 Ash St Unit 1
- 130 Ash St Unit 1B
- 130 Ash St Unit 1A
- 130 Ash St
- 130 Ash St Unit 2
- 130 Ash St Unit 1
- 130 Ash St Unit 3
- 7-9 Myrtle St
- 18 Myrtle St
- 18 Myrtle St Unit 1
- 22-24 Myrtle St
- 16 Myrtle St
- 16 Myrtle St Unit 1
- 22 Myrtle St Unit 24
- 10 Myrtle St