
Seller's Agent in 2025
Charles Crittenden
RE/MAX Resort Realty - Wailea
(808) 987-0793
56 Total Sales
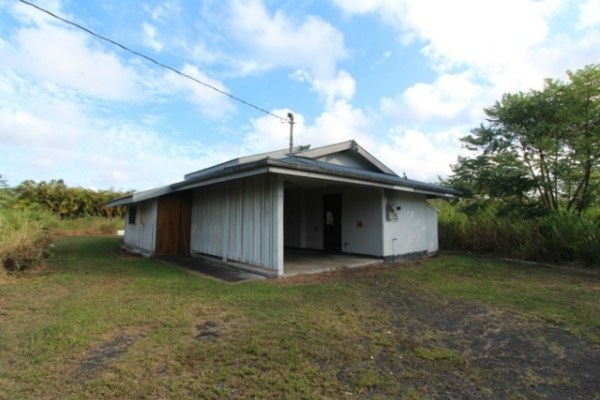
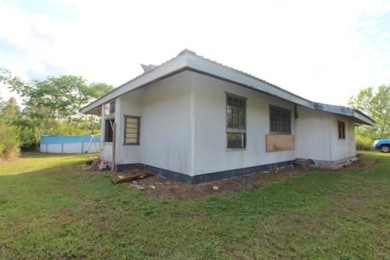
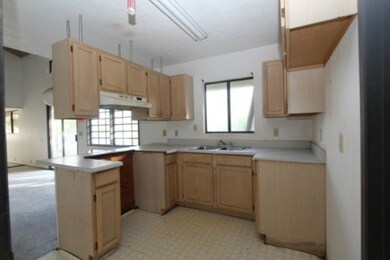
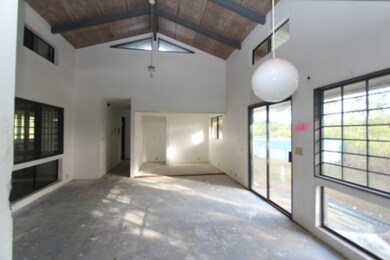
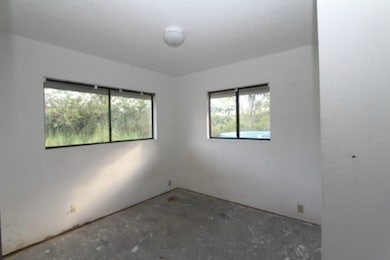
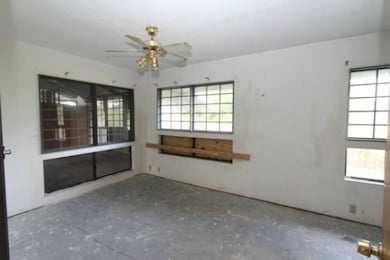
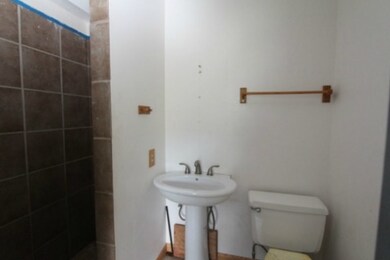
Now available is this 3 bedroom / 2 bath home located close to Shower Dr. in Hawaiian Paradise Park. Featuring a large living room with high ceilings, situated on one acre lot with ample room to grow.
* This is a Fannie Mae Home Path property
No warranties/guaranties or seller disclosure. Seller reserves the right to review/accept any offer regardless of order submitted. Buyer and Buyer's agent should independently verify all information pertinent to their purchase.
Last Agent to Sell the Property
eXp Realty Brokerage Phone: 8084437893 License #RB-24265 Listed on: 11/06/2014
Last Buyer's Agent
eXp Realty Brokerage Phone: 8084437893 License #RB-24265 Listed on: 11/06/2014
Home Type
Year Built
Lot Details
Parking
Home Design
Bedrooms and Bathrooms
Utilities
Community Details
Listing and Financial Details
| Date | Type | Sale Price | Title Company |
|---|---|---|---|
| Warranty Deed | $29,000 | Fam | |
| Interfamily Deed Transfer | -- | None Available | |
| Interfamily Deed Transfer | -- | -- | |
| Satisfaction Of Land Contract Or Release Satisfaction Of Agreement Of Sale Fee Property | -- | -- |
| Date | Event | Price | Change | Sq Ft Price |
|---|---|---|---|---|
| 05/19/2025 05/19/25 | Price Changed | $360,000 | -39.0% | $331 / Sq Ft |
| 05/12/2025 05/12/25 | Price Changed | $590,000 | -4.8% | $352 / Sq Ft |
| 04/07/2025 04/07/25 | Price Changed | $620,000 | +37.8% | $369 / Sq Ft |
| 04/03/2025 04/03/25 | Sold | $450,000 | 0.0% | $391 / Sq Ft |
| 04/03/2025 04/03/25 | Pending | -- | -- | -- |
| 04/03/2025 04/03/25 | For Sale | $450,000 | -18.9% | $391 / Sq Ft |
| 03/19/2025 03/19/25 | Sold | $555,000 | +42.3% | $340 / Sq Ft |
| 03/19/2025 03/19/25 | Price Changed | $390,000 | -39.1% | $358 / Sq Ft |
| 03/05/2025 03/05/25 | For Sale | $640,000 | +18.5% | $381 / Sq Ft |
| 02/24/2025 02/24/25 | Sold | $540,000 | +35.0% | $352 / Sq Ft |
| 02/02/2025 02/02/25 | For Sale | $400,000 | -28.4% | $368 / Sq Ft |
| 01/20/2025 01/20/25 | For Sale | $559,000 | -0.2% | $343 / Sq Ft |
| 01/16/2025 01/16/25 | Off Market | $560,000 | -- | -- |
| 01/11/2025 01/11/25 | For Sale | $560,000 | 0.0% | $365 / Sq Ft |
| 01/08/2025 01/08/25 | Off Market | $560,000 | -- | -- |
| 01/06/2025 01/06/25 | Off Market | $560,000 | -- | -- |
| 01/02/2025 01/02/25 | For Sale | $560,000 | 0.0% | $365 / Sq Ft |
| 01/01/2025 01/01/25 | For Sale | $560,000 | +96.5% | $365 / Sq Ft |
| 11/02/2024 11/02/24 | Off Market | $285,000 | -- | -- |
| 10/16/2024 10/16/24 | Off Market | $193,100 | -- | -- |
| 10/12/2024 10/12/24 | Off Market | $389,000 | -- | -- |
| 10/10/2024 10/10/24 | Off Market | $350,000 | -- | -- |
| 09/26/2024 09/26/24 | Off Market | $475,000 | -- | -- |
| 09/24/2024 09/24/24 | Off Market | $633,302 | -- | -- |
| 09/20/2024 09/20/24 | Off Market | $589,000 | -- | -- |
| 09/18/2024 09/18/24 | Sold | $475,000 | -25.0% | $269 / Sq Ft |
| 09/16/2024 09/16/24 | Sold | $633,302 | +12.1% | $338 / Sq Ft |
| 09/16/2024 09/16/24 | Off Market | $565,000 | -- | -- |
| 09/10/2024 09/10/24 | For Sale | $849,900 | +32.8% | $460 / Sq Ft |
| 07/26/2024 07/26/24 | Price Changed | $640,000 | +25.5% | $342 / Sq Ft |
| 07/23/2024 07/23/24 | Sold | $510,000 | +7.4% | $382 / Sq Ft |
| 07/23/2024 07/23/24 | Price Changed | $475,000 | -15.9% | $269 / Sq Ft |
| 06/28/2024 06/28/24 | Sold | $565,000 | +13.3% | $260 / Sq Ft |
| 06/25/2024 06/25/24 | For Sale | $498,500 | -25.6% | $282 / Sq Ft |
| 06/19/2024 06/19/24 | Price Changed | $670,000 | -18.8% | $358 / Sq Ft |
| 06/06/2024 06/06/24 | Sold | $825,000 | -2.9% | $325 / Sq Ft |
| 05/28/2024 05/28/24 | Off Market | $850,000 | -- | -- |
| 05/22/2024 05/22/24 | For Sale | $850,000 | +50.4% | $335 / Sq Ft |
| 05/16/2024 05/16/24 | Off Market | $565,000 | -- | -- |
| 05/16/2024 05/16/24 | For Sale | $565,000 | -33.5% | $260 / Sq Ft |
| 05/15/2024 05/15/24 | Off Market | $850,000 | -- | -- |
| 05/10/2024 05/10/24 | Off Market | $850,000 | -- | -- |
| 05/10/2024 05/10/24 | For Sale | $850,000 | 0.0% | $335 / Sq Ft |
| 04/29/2024 04/29/24 | For Sale | $850,000 | +24.1% | $335 / Sq Ft |
| 04/28/2024 04/28/24 | For Sale | $685,000 | +16.3% | $366 / Sq Ft |
| 04/28/2024 04/28/24 | Off Market | $589,000 | -- | -- |
| 04/28/2024 04/28/24 | Off Market | $685,000 | -- | -- |
| 04/28/2024 04/28/24 | Off Market | $450,000 | -- | -- |
| 04/27/2024 04/27/24 | Off Market | $565,000 | -- | -- |
| 04/26/2024 04/26/24 | For Sale | $565,000 | 0.0% | $260 / Sq Ft |
| 04/16/2024 04/16/24 | Off Market | $565,000 | -- | -- |
| 04/15/2024 04/15/24 | For Sale | $540,000 | -21.2% | $405 / Sq Ft |
| 04/08/2024 04/08/24 | Off Market | $685,000 | -- | -- |
| 04/07/2024 04/07/24 | For Sale | $685,000 | +16.3% | $366 / Sq Ft |
| 04/07/2024 04/07/24 | Off Market | $589,000 | -- | -- |
| 04/07/2024 04/07/24 | Off Market | $565,000 | -- | -- |
| 04/04/2024 04/04/24 | Off Market | $685,000 | -- | -- |
| 04/04/2024 04/04/24 | Price Changed | $685,000 | +21.2% | $366 / Sq Ft |
| 03/09/2024 03/09/24 | For Sale | $565,000 | -21.0% | $260 / Sq Ft |
| 03/05/2024 03/05/24 | For Sale | $715,000 | +46.2% | $382 / Sq Ft |
| 02/18/2024 02/18/24 | Off Market | $489,000 | -- | -- |
| 02/16/2024 02/16/24 | Sold | $589,000 | +30.9% | $361 / Sq Ft |
| 02/09/2024 02/09/24 | Sold | $450,000 | -23.1% | $177 / Sq Ft |
| 02/08/2024 02/08/24 | For Sale | $585,000 | -17.7% | $269 / Sq Ft |
| 01/15/2024 01/15/24 | Off Market | $711,000 | -- | -- |
| 01/03/2024 01/03/24 | Pending | -- | -- | -- |
| 11/26/2023 11/26/23 | For Sale | $589,000 | -17.2% | $361 / Sq Ft |
| 10/28/2023 10/28/23 | Off Market | $711,000 | -- | -- |
| 10/22/2023 10/22/23 | For Sale | $489,000 | -31.2% | $193 / Sq Ft |
| 09/29/2023 09/29/23 | Sold | $711,000 | +18.9% | $382 / Sq Ft |
| 09/15/2023 09/15/23 | Off Market | $598,000 | -- | -- |
| 08/28/2023 08/28/23 | Sold | $465,000 | -37.9% | $377 / Sq Ft |
| 08/08/2023 08/08/23 | Pending | -- | -- | -- |
| 07/17/2023 07/17/23 | For Sale | $749,000 | +52.9% | $403 / Sq Ft |
| 07/10/2023 07/10/23 | For Sale | $490,000 | +19.5% | $398 / Sq Ft |
| 06/22/2023 06/22/23 | Sold | $410,000 | -31.4% | $220 / Sq Ft |
| 06/16/2023 06/16/23 | Sold | $598,000 | +17.3% | $265 / Sq Ft |
| 05/23/2023 05/23/23 | Sold | $510,000 | -14.7% | $259 / Sq Ft |
| 05/04/2023 05/04/23 | Pending | -- | -- | -- |
| 04/18/2023 04/18/23 | Pending | -- | -- | -- |
| 04/13/2023 04/13/23 | Off Market | $598,000 | -- | -- |
| 04/12/2023 04/12/23 | For Sale | $445,000 | -3.1% | $226 / Sq Ft |
| 03/23/2023 03/23/23 | For Sale | $459,000 | -23.2% | $247 / Sq Ft |
| 03/06/2023 03/06/23 | For Sale | $598,000 | +25.2% | $265 / Sq Ft |
| 03/30/2022 03/30/22 | Sold | $477,500 | -3.5% | $298 / Sq Ft |
| 01/10/2022 01/10/22 | Pending | -- | -- | -- |
| 11/30/2021 11/30/21 | For Sale | $495,000 | +15.4% | $309 / Sq Ft |
| 05/11/2021 05/11/21 | Sold | $429,000 | 0.0% | $276 / Sq Ft |
| 03/17/2021 03/17/21 | Pending | -- | -- | -- |
| 02/22/2021 02/22/21 | For Sale | $429,000 | +10.3% | $276 / Sq Ft |
| 01/25/2021 01/25/21 | Sold | $389,000 | +11.1% | $247 / Sq Ft |
| 11/26/2020 11/26/20 | Off Market | $350,000 | -- | -- |
| 11/12/2020 11/12/20 | Pending | -- | -- | -- |
| 11/02/2020 11/02/20 | Sold | $488,000 | +71.2% | $263 / Sq Ft |
| 10/23/2020 10/23/20 | Off Market | $285,000 | -- | -- |
| 10/06/2020 10/06/20 | For Sale | $395,000 | +12.9% | $251 / Sq Ft |
| 09/18/2020 09/18/20 | Pending | -- | -- | -- |
| 08/28/2020 08/28/20 | Sold | $350,000 | -11.2% | $218 / Sq Ft |
| 08/18/2020 08/18/20 | Off Market | $394,000 | -- | -- |
| 08/12/2020 08/12/20 | Sold | $299,000 | +4.9% | $229 / Sq Ft |
| 07/20/2020 07/20/20 | Sold | $285,000 | -22.6% | $234 / Sq Ft |
| 07/13/2020 07/13/20 | Pending | -- | -- | -- |
| 06/26/2020 06/26/20 | Sold | $368,000 | -24.1% | $280 / Sq Ft |
| 06/15/2020 06/15/20 | For Sale | $485,000 | +23.1% | $261 / Sq Ft |
| 05/29/2020 05/29/20 | Pending | -- | -- | -- |
| 05/20/2020 05/20/20 | Pending | -- | -- | -- |
| 05/19/2020 05/19/20 | Sold | $394,000 | +31.8% | $210 / Sq Ft |
| 05/12/2020 05/12/20 | For Sale | $299,000 | -15.3% | $229 / Sq Ft |
| 05/07/2020 05/07/20 | For Sale | $353,000 | -5.1% | $220 / Sq Ft |
| 05/06/2020 05/06/20 | Pending | -- | -- | -- |
| 05/01/2020 05/01/20 | For Sale | $372,000 | +26.1% | $283 / Sq Ft |
| 03/11/2020 03/11/20 | Pending | -- | -- | -- |
| 01/21/2020 01/21/20 | For Sale | $295,000 | -7.8% | $243 / Sq Ft |
| 01/15/2020 01/15/20 | Sold | $320,000 | 0.0% | $278 / Sq Ft |
| 11/20/2019 11/20/19 | Pending | -- | -- | -- |
| 11/12/2019 11/12/19 | For Sale | $320,000 | -28.1% | $278 / Sq Ft |
| 09/11/2019 09/11/19 | For Sale | $445,000 | +29.0% | $238 / Sq Ft |
| 05/03/2019 05/03/19 | Sold | $345,000 | +78.7% | $175 / Sq Ft |
| 05/03/2019 05/03/19 | Pending | -- | -- | -- |
| 10/30/2018 10/30/18 | Sold | $193,100 | -50.4% | $115 / Sq Ft |
| 10/16/2018 10/16/18 | For Sale | $389,000 | +144.7% | $197 / Sq Ft |
| 09/18/2018 09/18/18 | Pending | -- | -- | -- |
| 09/07/2018 09/07/18 | For Sale | $159,000 | -36.4% | $95 / Sq Ft |
| 06/29/2018 06/29/18 | Sold | $250,000 | -9.1% | $161 / Sq Ft |
| 06/20/2018 06/20/18 | Sold | $275,000 | +10.0% | $208 / Sq Ft |
| 06/19/2018 06/19/18 | Pending | -- | -- | -- |
| 06/19/2018 06/19/18 | For Sale | $250,000 | -28.6% | $161 / Sq Ft |
| 05/19/2018 05/19/18 | Pending | -- | -- | -- |
| 05/10/2018 05/10/18 | Off Market | $350,000 | -- | -- |
| 04/27/2018 04/27/18 | For Sale | $289,000 | -17.4% | $218 / Sq Ft |
| 02/09/2018 02/09/18 | Sold | $350,000 | +17.1% | $208 / Sq Ft |
| 01/19/2018 01/19/18 | Pending | -- | -- | -- |
| 12/08/2017 12/08/17 | Off Market | $299,000 | -- | -- |
| 09/08/2017 09/08/17 | Sold | $299,000 | -16.7% | $195 / Sq Ft |
| 07/19/2017 07/19/17 | For Sale | $359,000 | +16.2% | $213 / Sq Ft |
| 07/11/2017 07/11/17 | Pending | -- | -- | -- |
| 05/12/2017 05/12/17 | For Sale | $309,000 | -31.3% | $201 / Sq Ft |
| 04/13/2017 04/13/17 | Off Market | $450,000 | -- | -- |
| 03/22/2017 03/22/17 | Sold | $425,000 | -5.6% | $178 / Sq Ft |
| 01/25/2017 01/25/17 | Pending | -- | -- | -- |
| 01/13/2017 01/13/17 | Sold | $450,000 | -1.1% | $168 / Sq Ft |
| 10/15/2016 10/15/16 | Pending | -- | -- | -- |
| 09/30/2016 09/30/16 | Sold | $455,000 | -6.2% | $179 / Sq Ft |
| 09/07/2016 09/07/16 | For Sale | $485,000 | +73.8% | $182 / Sq Ft |
| 08/29/2016 08/29/16 | Off Market | $279,000 | -- | -- |
| 08/15/2016 08/15/16 | For Sale | $495,000 | +289.8% | $207 / Sq Ft |
| 08/08/2016 08/08/16 | Pending | -- | -- | -- |
| 07/27/2016 07/27/16 | Sold | $127,000 | -73.3% | $144 / Sq Ft |
| 07/11/2016 07/11/16 | For Sale | $475,000 | +493.8% | $187 / Sq Ft |
| 06/16/2016 06/16/16 | Sold | $80,000 | -71.3% | $250 / Sq Ft |
| 05/31/2016 05/31/16 | Sold | $279,000 | +39.5% | $132 / Sq Ft |
| 05/22/2016 05/22/16 | Off Market | $200,000 | -- | -- |
| 05/14/2016 05/14/16 | Pending | -- | -- | -- |
| 05/09/2016 05/09/16 | Pending | -- | -- | -- |
| 03/31/2016 03/31/16 | For Sale | $160,000 | +14.3% | $500 / Sq Ft |
| 03/21/2016 03/21/16 | For Sale | $140,000 | -30.0% | $159 / Sq Ft |
| 03/02/2016 03/02/16 | Pending | -- | -- | -- |
| 02/22/2016 02/22/16 | Sold | $200,000 | +11.2% | $117 / Sq Ft |
| 12/02/2015 12/02/15 | Pending | -- | -- | -- |
| 10/21/2015 10/21/15 | Sold | $179,900 | -36.9% | $199 / Sq Ft |
| 09/22/2015 09/22/15 | Sold | $285,000 | -2.1% | $297 / Sq Ft |
| 09/22/2015 09/22/15 | Pending | -- | -- | -- |
| 09/22/2015 09/22/15 | For Sale | $291,000 | +61.8% | $303 / Sq Ft |
| 08/29/2015 08/29/15 | Pending | -- | -- | -- |
| 08/24/2015 08/24/15 | For Sale | $179,900 | -25.0% | $199 / Sq Ft |
| 08/21/2015 08/21/15 | For Sale | $239,900 | -26.2% | $141 / Sq Ft |
| 08/07/2015 08/07/15 | For Sale | $325,000 | +194.1% | $153 / Sq Ft |
| 07/31/2015 07/31/15 | Sold | $110,500 | -27.7% | $107 / Sq Ft |
| 07/14/2015 07/14/15 | Pending | -- | -- | -- |
| 04/13/2015 04/13/15 | For Sale | $152,900 | +66.2% | $149 / Sq Ft |
| 01/20/2015 01/20/15 | Sold | $92,000 | -9.8% | $97 / Sq Ft |
| 12/31/2014 12/31/14 | Pending | -- | -- | -- |
| 11/06/2014 11/06/14 | For Sale | $102,000 | -66.0% | $107 / Sq Ft |
| 09/24/2014 09/24/14 | Sold | $300,000 | -4.8% | $93 / Sq Ft |
| 07/28/2014 07/28/14 | Sold | $315,000 | +1.6% | $223 / Sq Ft |
| 07/24/2014 07/24/14 | Pending | -- | -- | -- |
| 06/16/2014 06/16/14 | For Sale | $310,000 | +26.5% | $96 / Sq Ft |
| 05/16/2014 05/16/14 | Sold | $245,000 | -29.8% | $160 / Sq Ft |
| 05/14/2014 05/14/14 | Pending | -- | -- | -- |
| 04/04/2014 04/04/14 | For Sale | $349,000 | +36.9% | $248 / Sq Ft |
| 02/27/2014 02/27/14 | Pending | -- | -- | -- |
| 10/09/2013 10/09/13 | For Sale | $255,000 | +37.8% | $166 / Sq Ft |
| 08/12/2013 08/12/13 | Sold | $185,000 | +2.8% | $177 / Sq Ft |
| 07/25/2013 07/25/13 | Sold | $180,000 | -5.3% | $140 / Sq Ft |
| 06/04/2013 06/04/13 | Pending | -- | -- | -- |
| 05/23/2013 05/23/13 | For Sale | $190,000 | +8.6% | $181 / Sq Ft |
| 02/11/2013 02/11/13 | Sold | $175,000 | -2.8% | $156 / Sq Ft |
| 01/30/2013 01/30/13 | Pending | -- | -- | -- |
| 12/10/2012 12/10/12 | Pending | -- | -- | -- |
| 09/13/2012 09/13/12 | For Sale | $180,000 | -30.8% | $161 / Sq Ft |
| 08/27/2012 08/27/12 | Sold | $260,000 | +32.7% | $134 / Sq Ft |
| 08/20/2012 08/20/12 | For Sale | $196,000 | +64.7% | $152 / Sq Ft |
| 06/25/2012 06/25/12 | Pending | -- | -- | -- |
| 06/15/2012 06/15/12 | Sold | $119,000 | -35.6% | $89 / Sq Ft |
| 05/21/2012 05/21/12 | Sold | $184,900 | -33.7% | $73 / Sq Ft |
| 05/11/2012 05/11/12 | For Sale | $279,000 | +99.3% | $144 / Sq Ft |
| 03/12/2012 03/12/12 | Pending | -- | -- | -- |
| 02/27/2012 02/27/12 | Pending | -- | -- | -- |
| 02/22/2012 02/22/12 | For Sale | $140,000 | -41.1% | $104 / Sq Ft |
| 10/03/2011 10/03/11 | For Sale | $237,500 | -- | $94 / Sq Ft |
| Year | Tax Paid | Tax Assessment Tax Assessment Total Assessment is a certain percentage of the fair market value that is determined by local assessors to be the total taxable value of land and additions on the property. | Land | Improvement |
|---|---|---|---|---|
| 2025 | $575 | $233,800 | $37,300 | $196,500 |
| 2024 | $575 | $227,000 | $37,300 | $189,700 |
| 2023 | $562 | $220,400 | $37,300 | $183,100 |
| 2022 | $561 | $214,000 | $37,300 | $176,700 |
| 2021 | $278 | $207,800 | $37,300 | $170,500 |
| 2020 | $501 | $201,700 | $37,300 | $164,400 |
| 2019 | $717 | $195,800 | $37,300 | $158,500 |
| 2018 | $694 | $191,000 | $34,100 | $156,900 |
| 2017 | $342 | $185,400 | $33,000 | $152,400 |
| 2016 | $643 | $180,600 | $34,000 | $146,600 |
| 2015 | -- | $167,300 | $34,000 | $133,300 |
| 2014 | -- | $29,500 | $29,500 | $0 |
Seller's Agent in 2025
Charles Crittenden
RE/MAX Resort Realty - Wailea
(808) 987-0793
56 Total Sales
K
Seller's Agent in 2025
Karen Kuis-Zelko
Big Island Homes & Land Co., Ltd.
26 Total Sales
J
Seller's Agent in 2025
Jasmine Matsumoto
eXp Realty
(808) 895-6406
13 Total Sales
L
Seller's Agent in 2025
Laura Fabella-Silva
Hilo Bay Realty LLC
(808) 216-6738
90 Total Sales
S
Seller's Agent in 2025
Shannon Takabayashi
Hilo Bay Realty LLC
(808) 987-3217
268 Total Sales
J
Seller Co-Listing Agent in 2025
Julie Zelko-Drummondo
Big Island Homes & Land Co., Ltd.
(808) 989-8948
16 Total Sales
Source: Hawaii Information Service (MLS Hawaii)
MLS Number: 278655
APN: 3-1-5-022-084-0000
Disclaimer: Certain information contained herein is derived from information provided by parties other than Homes.com. All information provided is deemed reliable, but is not guaranteed to be accurate and should be independently verified.
![]() Copyright 2025 MLS Hawaii, Inc. All rights reserved.
Copyright 2025 MLS Hawaii, Inc. All rights reserved.
IDX information is provided exclusively for consumers' personal, non-commercial use and may not be used for any purpose other than to identify prospective properties consumers may be interested in purchasing. Data is deemed reliable but is not guaranteed accurate by the MLS.