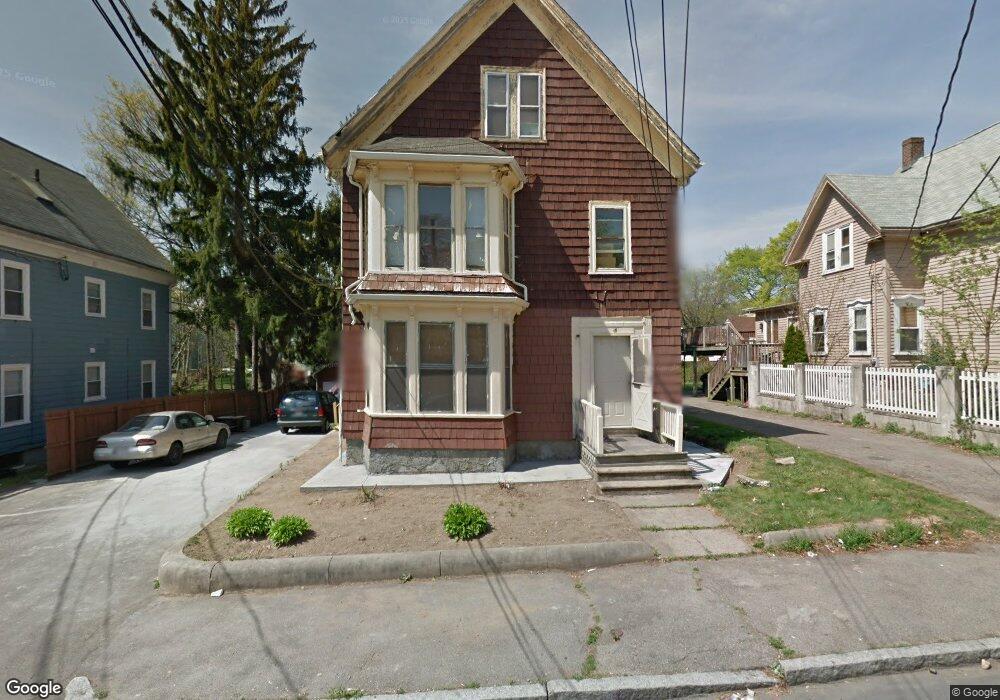
15 2nd St Brockton, MA 02301
Clifton Heights NeighborhoodEstimated Value: $476,201 - $801,000
5
Beds
4
Baths
2,589
Sq Ft
$259/Sq Ft
Est. Value
About This Home
This home is located at 15 2nd St, Brockton, MA 02301 and is currently estimated at $670,300, approximately $258 per square foot. 15 2nd St is a home located in Plymouth County with nearby schools including John F. Kennedy Elementary School, Davis K-8 School, and South Middle School.
Ownership History
Date
Name
Owned For
Owner Type
Purchase Details
Closed on
Sep 10, 2002
Sold by
Sheehan Daniel and Sheehan Janet M
Bought by
Cardoso Antonio and Cardoso Ines P
Current Estimated Value
Home Financials for this Owner
Home Financials are based on the most recent Mortgage that was taken out on this home.
Original Mortgage
$155,200
Outstanding Balance
$65,542
Interest Rate
6.39%
Mortgage Type
Purchase Money Mortgage
Estimated Equity
$604,758
Create a Home Valuation Report for This Property
The Home Valuation Report is an in-depth analysis detailing your home's value as well as a comparison with similar homes in the area
Home Values in the Area
Average Home Value in this Area
Purchase History
| Date | Buyer | Sale Price | Title Company |
|---|---|---|---|
| Cardoso Antonio | $194,000 | -- |
Source: Public Records
Mortgage History
| Date | Status | Borrower | Loan Amount |
|---|---|---|---|
| Open | Cardoso Antonio | $20,000 | |
| Open | Cardoso Antonio | $155,200 |
Source: Public Records
Tax History Compared to Growth
Tax History
| Year | Tax Paid | Tax Assessment Tax Assessment Total Assessment is a certain percentage of the fair market value that is determined by local assessors to be the total taxable value of land and additions on the property. | Land | Improvement |
|---|---|---|---|---|
| 2025 | $7,385 | $609,800 | $140,000 | $469,800 |
| 2024 | $7,213 | $600,100 | $140,000 | $460,100 |
| 2023 | $5,888 | $453,600 | $104,200 | $349,400 |
| 2022 | $5,974 | $427,600 | $94,700 | $332,900 |
| 2021 | $5,275 | $363,800 | $78,600 | $285,200 |
| 2020 | $4,851 | $320,200 | $73,600 | $246,600 |
| 2019 | $4,802 | $309,000 | $71,900 | $237,100 |
| 2018 | $4,548 | $283,200 | $71,900 | $211,300 |
| 2017 | $3,940 | $244,700 | $71,900 | $172,800 |
| 2016 | $3,538 | $203,800 | $69,700 | $134,100 |
| 2015 | $2,888 | $159,100 | $69,700 | $89,400 |
| 2014 | $2,870 | $158,300 | $69,700 | $88,600 |
Source: Public Records
Map
Nearby Homes