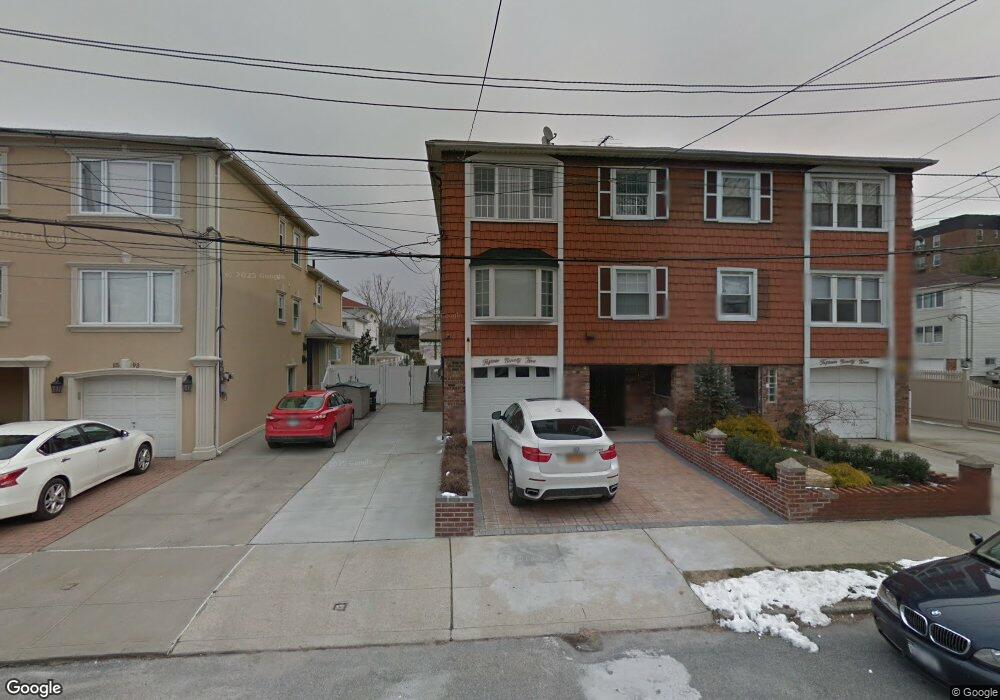
15-95 208th St Unit Upper Bayside, NY 11360
Bayside NeighborhoodEstimated Value: $1,420,043 - $1,726,000
3
Beds
2
Baths
3,267
Sq Ft
$495/Sq Ft
Est. Value
About This Home
This home is located at 15-95 208th St Unit Upper, Bayside, NY 11360 and is currently estimated at $1,616,511, approximately $494 per square foot. 15-95 208th St Unit Upper is a home located in Queens County with nearby schools including P.S. 209 - Clearview Gardens, J.H.S. 194 William Carr, and Bayside High School.
Ownership History
Date
Name
Owned For
Owner Type
Purchase Details
Closed on
Apr 16, 2015
Sold by
Chen Bi Fang and Zhu Jian Hui
Bought by
Yan
Current Estimated Value
Purchase Details
Closed on
May 1, 2013
Sold by
Chen Bi F
Bought by
Chen Bi F and Zhu Jian H
Purchase Details
Closed on
Jul 26, 2011
Sold by
Gaizo Francis X
Bought by
Chen Bi Fang
Home Financials for this Owner
Home Financials are based on the most recent Mortgage that was taken out on this home.
Original Mortgage
$499,000
Interest Rate
4.52%
Purchase Details
Closed on
Aug 31, 2000
Sold by
Amplo Karen Tesi and Gaizo Denise Tesi
Bought by
Amplo Karen Tesi and Gaizo Denise Tesi
Home Financials for this Owner
Home Financials are based on the most recent Mortgage that was taken out on this home.
Original Mortgage
$186,000
Interest Rate
7.88%
Purchase Details
Closed on
Dec 19, 1996
Sold by
Tesi James and Tesi Michael
Bought by
Amplo Karen Teri and Gaizo Denise Tesi
Create a Home Valuation Report for This Property
The Home Valuation Report is an in-depth analysis detailing your home's value as well as a comparison with similar homes in the area
Home Values in the Area
Average Home Value in this Area
Purchase History
| Date | Buyer | Sale Price | Title Company |
|---|---|---|---|
| Yan | $1,270,000 | -- | |
| Yan | $1,270,000 | -- | |
| Chen Bi F | -- | -- | |
| Chen Bi F | -- | -- | |
| Chen Bi Fang | $850,000 | -- | |
| Amplo Karen Tesi | -- | -- | |
| Amplo Karen Tesi | -- | -- | |
| Amplo Karen Teri | -- | Chicago Title Insurance Co | |
| Amplo Karen Teri | -- | Chicago Title Insurance Co |
Source: Public Records
Mortgage History
| Date | Status | Borrower | Loan Amount |
|---|---|---|---|
| Previous Owner | Chen Bi Fang | $499,000 | |
| Previous Owner | Amplo Karen Tesi | $186,000 |
Source: Public Records
Tax History Compared to Growth
Tax History
| Year | Tax Paid | Tax Assessment Tax Assessment Total Assessment is a certain percentage of the fair market value that is determined by local assessors to be the total taxable value of land and additions on the property. | Land | Improvement |
|---|---|---|---|---|
| 2025 | $15,214 | $80,293 | $12,416 | $67,877 |
| 2024 | $15,214 | $75,749 | $12,716 | $63,033 |
| 2023 | $14,353 | $71,462 | $11,393 | $60,069 |
| 2022 | $14,266 | $90,900 | $15,420 | $75,480 |
| 2021 | $14,872 | $82,440 | $15,420 | $67,020 |
| 2020 | $14,163 | $86,700 | $15,420 | $71,280 |
| 2019 | $13,205 | $86,400 | $15,420 | $70,980 |
| 2018 | $12,140 | $59,552 | $11,809 | $47,743 |
| 2017 | $12,140 | $59,552 | $12,680 | $46,872 |
| 2016 | $11,773 | $59,552 | $12,680 | $46,872 |
| 2015 | $6,556 | $55,759 | $15,348 | $40,411 |
| 2014 | $6,556 | $52,604 | $15,623 | $36,981 |
Source: Public Records
Map
Nearby Homes
- 209-25 18th Ave Unit 3J
- 209-25 18th Ave Unit 1C
- 209-25 18th Ave Unit 3C
- 209-83 18th Ave Unit 199
- 209-15 18th Ave Unit 2A
- 20915 18th Ave Unit 3E
- 209-80 18th Ave Unit 2G
- 209-80 18th Ave Unit 4D
- 209-80 18th Ave Unit 6E
- 209-80 18th Ave Unit 3E
- 208-18 15th Rd
- 209-20 18th Ave Unit 6C
- 209-20 18th Ave Unit 5E
- 15-63 212th St Unit 177
- 210 E 15th St Unit 2N
- 210 E 15th St Unit PHD
- 210 E 15th St Unit 10E
- 210 E 15th St Unit 6A
- 210 E 15th St Unit 2H
- 210 E 15th St Unit 1A
- 15-95 208th St
- 1595 208th St
- 1599 208th St
- 1593 208th St
- 1589 208th St
- 1587 208th St
- 1598 208th Place
- 15-98 208th Place
- 1596 208th Place
- 15-92 208 St
- 15-92 208th St
- 15-96 208th Place Unit 2
- 15-96 208th Place
- 1592 208th Place
- 1592 208th Place
- 1583 208th St
- 208-16 15th Dr
- 1590 208th Place
- 20802 15th Dr
- 20802 15th Dr Unit 2