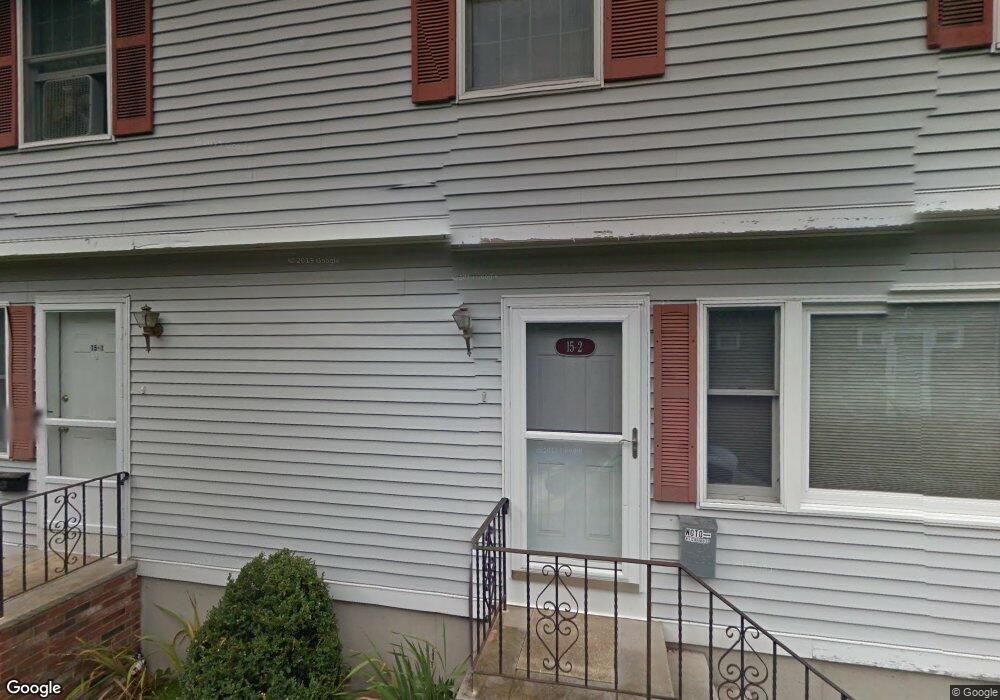
15 Aborn Place Unit 2 15 Peabody, MA 01960
Peabody Town Center NeighborhoodEstimated Value: $476,000 - $560,000
2
Beds
2
Baths
917
Sq Ft
$565/Sq Ft
Est. Value
About This Home
This home is located at 15 Aborn Place Unit 2 15, Peabody, MA 01960 and is currently estimated at $518,418, approximately $565 per square foot. 15 Aborn Place Unit 2 15 is a home located in Essex County with nearby schools including Peabody Veterans Memorial High School, St John The Baptist School, and The Phoenix School.
Ownership History
Date
Name
Owned For
Owner Type
Purchase Details
Closed on
Nov 30, 2020
Sold by
Noto Phillip P
Bought by
Brandano Barbara A and Brandano Richard
Current Estimated Value
Home Financials for this Owner
Home Financials are based on the most recent Mortgage that was taken out on this home.
Original Mortgage
$384,750
Outstanding Balance
$341,591
Interest Rate
2.8%
Mortgage Type
New Conventional
Estimated Equity
$176,827
Purchase Details
Closed on
Mar 31, 2010
Sold by
Khan Dara J and Khan Waqar R
Bought by
Noto Phillip P
Home Financials for this Owner
Home Financials are based on the most recent Mortgage that was taken out on this home.
Original Mortgage
$116,000
Interest Rate
4.94%
Mortgage Type
Purchase Money Mortgage
Purchase Details
Closed on
Dec 18, 2001
Sold by
Kennedy Carrie and Jeffrey Carrie
Bought by
Khan Dara J and Khan Waqar R
Purchase Details
Closed on
Feb 17, 1999
Sold by
Baker Edward M and Baker Dorothie H
Bought by
Jeffrey Carrie
Create a Home Valuation Report for This Property
The Home Valuation Report is an in-depth analysis detailing your home's value as well as a comparison with similar homes in the area
Home Values in the Area
Average Home Value in this Area
Purchase History
| Date | Buyer | Sale Price | Title Company |
|---|---|---|---|
| Brandano Barbara A | $405,000 | None Available | |
| Brandano Barbara A | $405,000 | None Available | |
| Noto Phillip P | $145,000 | -- | |
| Noto Phillip P | $145,000 | -- | |
| Khan Dara J | $175,000 | -- | |
| Khan Dara J | $175,000 | -- | |
| Jeffrey Carrie | $103,000 | -- |
Source: Public Records
Mortgage History
| Date | Status | Borrower | Loan Amount |
|---|---|---|---|
| Open | Brandano Barbara A | $384,750 | |
| Closed | Brandano Barbara A | $384,750 | |
| Previous Owner | Jeffrey Carrie | $123,700 | |
| Previous Owner | Jeffrey Carrie | $116,000 |
Source: Public Records
Tax History Compared to Growth
Tax History
| Year | Tax Paid | Tax Assessment Tax Assessment Total Assessment is a certain percentage of the fair market value that is determined by local assessors to be the total taxable value of land and additions on the property. | Land | Improvement |
|---|---|---|---|---|
| 2025 | $4,181 | $451,500 | $0 | $451,500 |
| 2024 | $3,679 | $403,400 | $0 | $403,400 |
| 2023 | $3,349 | $351,800 | $0 | $351,800 |
| 2022 | $2,989 | $295,900 | $0 | $295,900 |
| 2021 | $2,496 | $237,900 | $0 | $237,900 |
| 2020 | $2,272 | $211,500 | $0 | $211,500 |
| 2019 | $2,037 | $185,000 | $0 | $185,000 |
| 2018 | $2,044 | $178,400 | $0 | $178,400 |
| 2017 | $2,020 | $171,800 | $0 | $171,800 |
| 2016 | $1,969 | $165,200 | $0 | $165,200 |
| 2015 | $1,951 | $158,600 | $0 | $158,600 |
Source: Public Records
Map
Nearby Homes
- 9 Sutton St
- 13 State St
- 12 Sutton St
- 2 Osborne St
- 10 Elliott Place Unit 1R
- 46 Sutton St
- 111 Foster St Unit 401
- 176 Marlborough Rd
- 159 Marlborough Rd
- 46 Walnut St
- 15 Wall St
- 36 Summit St
- 48 Franklin St
- 55 Butler St
- 145 Boston St
- 39 Gallows Hill Rd
- 26 Elm St
- 128 Boston St Unit 4
- 4 Elm St Unit 3
- 8 Crowninshield St Unit 111