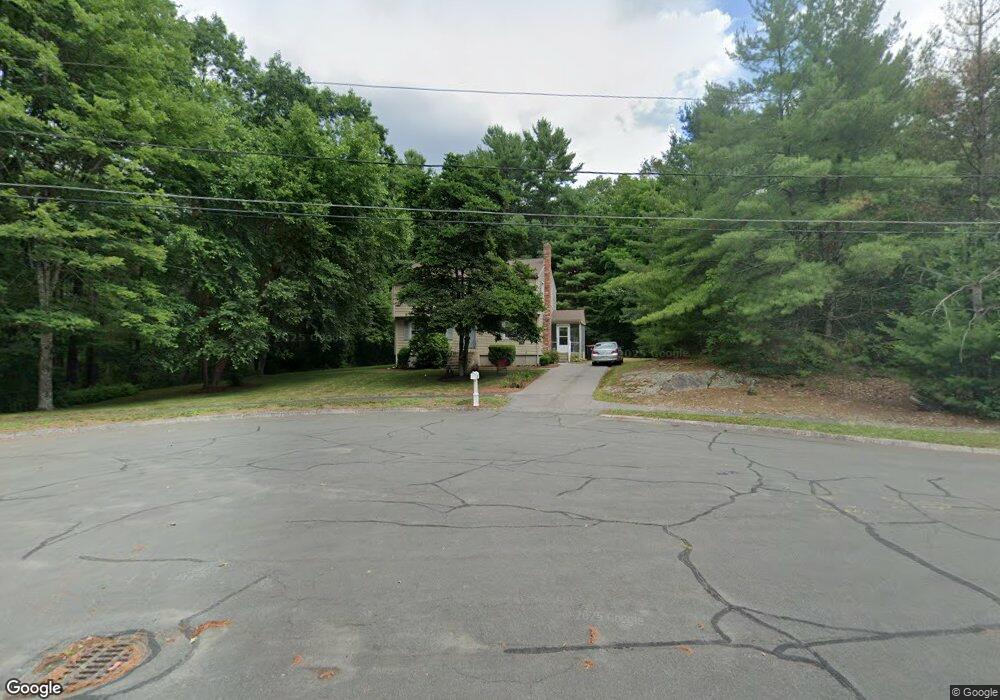
15 Alexander Rd Foxboro, MA 02035
Estimated Value: $690,613 - $770,000
4
Beds
2
Baths
1,802
Sq Ft
$398/Sq Ft
Est. Value
About This Home
This home is located at 15 Alexander Rd, Foxboro, MA 02035 and is currently estimated at $717,653, approximately $398 per square foot. 15 Alexander Rd is a home located in Norfolk County with nearby schools including Foxborough High School, Foxborough Regional Charter School, and Hands-On-Montessori School.
Ownership History
Date
Name
Owned For
Owner Type
Purchase Details
Closed on
Jul 31, 2013
Sold by
Shea Ft
Bought by
Shea James A
Current Estimated Value
Home Financials for this Owner
Home Financials are based on the most recent Mortgage that was taken out on this home.
Original Mortgage
$526,500
Outstanding Balance
$514,374
Interest Rate
4.45%
Mortgage Type
Stand Alone Refi Refinance Of Original Loan
Estimated Equity
$203,279
Purchase Details
Closed on
Jul 26, 2013
Sold by
Shea James A
Bought by
Shea Jane
Home Financials for this Owner
Home Financials are based on the most recent Mortgage that was taken out on this home.
Original Mortgage
$526,500
Outstanding Balance
$514,374
Interest Rate
4.45%
Mortgage Type
Stand Alone Refi Refinance Of Original Loan
Estimated Equity
$203,279
Purchase Details
Closed on
Aug 19, 2011
Sold by
Shea James A
Bought by
Shea Ft
Purchase Details
Closed on
Mar 17, 1973
Bought by
Shea Jane
Create a Home Valuation Report for This Property
The Home Valuation Report is an in-depth analysis detailing your home's value as well as a comparison with similar homes in the area
Home Values in the Area
Average Home Value in this Area
Purchase History
| Date | Buyer | Sale Price | Title Company |
|---|---|---|---|
| Shea James A | -- | -- | |
| Shea Jane | -- | -- | |
| Shea Ft | -- | -- | |
| Shea James A | -- | -- | |
| Shea Jane | $36,300 | -- |
Source: Public Records
Mortgage History
| Date | Status | Borrower | Loan Amount |
|---|---|---|---|
| Open | Shea Jane | $526,500 | |
| Previous Owner | Shea Jane | $50,000 |
Source: Public Records
Tax History Compared to Growth
Tax History
| Year | Tax Paid | Tax Assessment Tax Assessment Total Assessment is a certain percentage of the fair market value that is determined by local assessors to be the total taxable value of land and additions on the property. | Land | Improvement |
|---|---|---|---|---|
| 2025 | $7,011 | $530,300 | $232,000 | $298,300 |
| 2024 | $7,036 | $520,800 | $232,000 | $288,800 |
| 2023 | $6,760 | $475,700 | $220,800 | $254,900 |
| 2022 | $6,564 | $452,100 | $211,200 | $240,900 |
| 2021 | $6,322 | $428,900 | $192,000 | $236,900 |
| 2020 | $6,133 | $420,900 | $192,000 | $228,900 |
| 2019 | $5,855 | $398,300 | $182,900 | $215,400 |
| 2018 | $5,748 | $394,500 | $182,900 | $211,600 |
| 2017 | $5,539 | $368,300 | $170,900 | $197,400 |
| 2016 | $5,396 | $364,100 | $164,600 | $199,500 |
| 2015 | $5,300 | $348,900 | $139,000 | $209,900 |
| 2014 | $5,127 | $342,000 | $136,300 | $205,700 |
Source: Public Records
Map
Nearby Homes
- 67 Morse St
- 12 Community Way
- 9 Independence Dr Unit 9
- 35 Independence Dr Unit 35
- 5 Lauren Ln
- 124 E Belcher Rd
- 132 Cannon Forge Dr
- 170 Cannon Forge Dr
- 261 East St
- 18 Winter St Unit E
- 11 W Belcher Rd Unit 5
- 619 N Main St
- 60 King St
- 84 Cocasset St Unit A6
- 194 Central St
- 44 Angell St Unit 44
- 28 Angell St
- 19 Fuller Rd Unit 7
- 89 Oak St
- 356 Central St