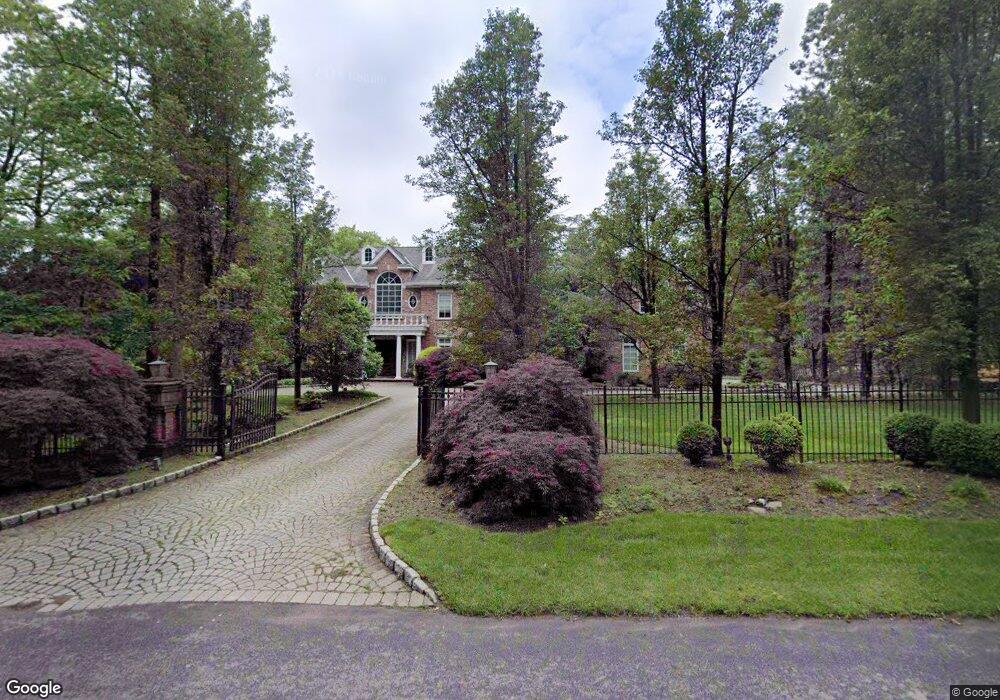
15 Allison Rd Alpine, NJ 07620
Estimated Value: $4,825,967 - $5,631,000
Studio
--
Bath
7,050
Sq Ft
$756/Sq Ft
Est. Value
About This Home
This home is located at 15 Allison Rd, Alpine, NJ 07620 and is currently estimated at $5,328,322, approximately $755 per square foot. 15 Allison Rd is a home with nearby schools including Alpine Elementary School and Academy Of The Holy Angels.
Ownership History
Date
Name
Owned For
Owner Type
Purchase Details
Closed on
Jun 23, 2006
Sold by
Sabato Ulises C
Bought by
Cook Lorin and Cook Jonathan
Current Estimated Value
Home Financials for this Owner
Home Financials are based on the most recent Mortgage that was taken out on this home.
Original Mortgage
$915,000
Outstanding Balance
$538,246
Interest Rate
6.58%
Estimated Equity
$4,790,076
Purchase Details
Closed on
Apr 22, 2002
Sold by
Alliotts Frank
Bought by
Sabato Jaimee and Sabato Ulises C
Home Financials for this Owner
Home Financials are based on the most recent Mortgage that was taken out on this home.
Original Mortgage
$2,450,000
Interest Rate
7%
Purchase Details
Closed on
Jul 27, 1999
Sold by
Alliotts Construction Co Inc
Bought by
Alliotts Frank and Alliotts Kathleen
Purchase Details
Closed on
Aug 11, 1997
Sold by
Smith Mary Louise
Bought by
Alliots Construction Inc
Create a Home Valuation Report for This Property
The Home Valuation Report is an in-depth analysis detailing your home's value as well as a comparison with similar homes in the area
Home Values in the Area
Average Home Value in this Area
Purchase History
| Date | Buyer | Sale Price | Title Company |
|---|---|---|---|
| Cook Lorin | $4,700,000 | -- | |
| Sabato Jaimee | $3,500,000 | -- | |
| Alliotts Frank | $525,000 | -- | |
| Alliots Construction Inc | $525,000 | -- |
Source: Public Records
Mortgage History
| Date | Status | Borrower | Loan Amount |
|---|---|---|---|
| Open | Cook Lorin | $915,000 | |
| Previous Owner | Sabato Jaimee | $2,450,000 |
Source: Public Records
Tax History
| Year | Tax Paid | Tax Assessment Tax Assessment Total Assessment is a certain percentage of the fair market value that is determined by local assessors to be the total taxable value of land and additions on the property. | Land | Improvement |
|---|---|---|---|---|
| 2025 | $26,994 | $3,300,000 | $1,080,000 | $2,220,000 |
| 2024 | $26,070 | $3,300,000 | $1,080,000 | $2,220,000 |
| 2023 | $25,311 | $3,300,000 | $1,080,000 | $2,220,000 |
| 2022 | $25,311 | $3,300,000 | $1,080,000 | $2,220,000 |
| 2021 | $25,707 | $3,300,000 | $1,080,000 | $2,220,000 |
| 2020 | $25,047 | $3,300,000 | $1,080,000 | $2,220,000 |
| 2019 | $25,707 | $3,300,000 | $1,080,000 | $2,220,000 |
| 2018 | $25,608 | $3,300,000 | $1,080,000 | $2,220,000 |
| 2017 | $26,433 | $3,300,000 | $1,080,000 | $2,220,000 |
| 2016 | $25,344 | $3,300,000 | $1,080,000 | $2,220,000 |
| 2015 | $25,410 | $3,300,000 | $1,080,000 | $2,220,000 |
| 2014 | $24,453 | $3,300,000 | $1,080,000 | $2,220,000 |
Source: Public Records
Map
Nearby Homes
- 978 Closter Dock Rd
- 982 Closter Dock Rd
- 35 Old Dock Rd
- 11 Schaffer Rd
- 28 Schaffer Rd
- 5 Ellens Way
- 6 Frick Dr
- 76 Church St
- 7 Schaffer Rd
- 32 Schaffer Rd
- 38 Cambridge Way
- 34 Cambridge Way
- 32 Litchfield Way
- 1 Stone Bridge Ct
- 6 Stone Bridge Ct
- 4 Duck Pond Rd
- 36 Marie Major Dr
- 6 Old Farm Way
- 12 Cambridge Way
- 19 Autumn Terrace
Your Personal Tour Guide
Ask me questions while you tour the home.