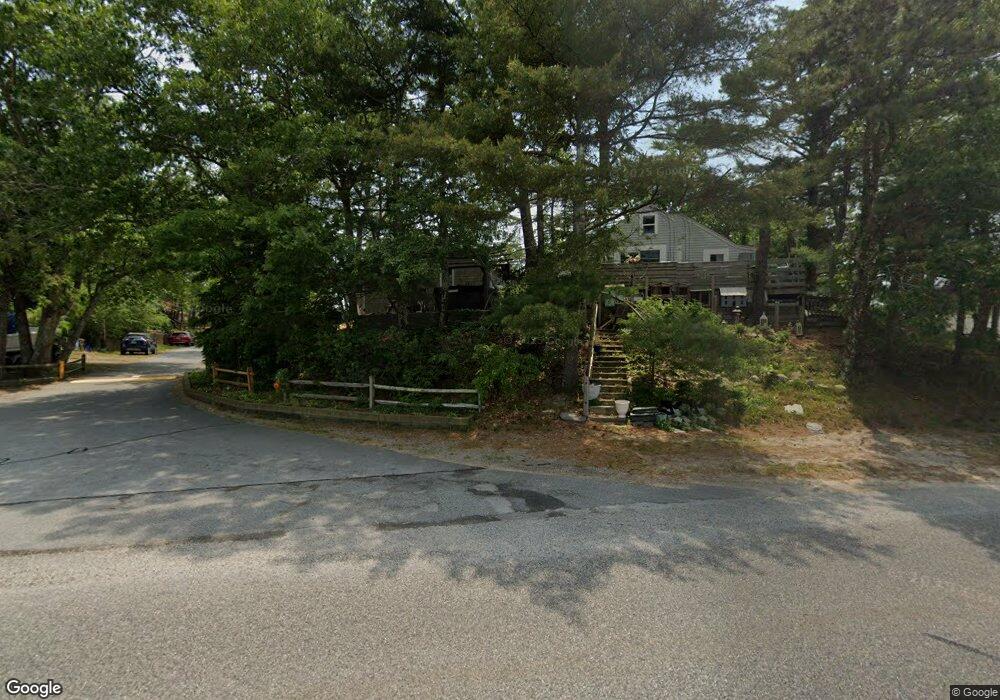
15 Bakers Ln Bourne, MA 02532
Buzzards Bay NeighborhoodEstimated Value: $302,000 - $347,000
1
Bed
2
Baths
504
Sq Ft
$652/Sq Ft
Est. Value
About This Home
This home is located at 15 Bakers Ln, Bourne, MA 02532 and is currently estimated at $328,684, approximately $652 per square foot. 15 Bakers Ln is a home located in Barnstable County with nearby schools including South Elementary School, Plymouth South Middle School, and Plymouth South High School.
Ownership History
Date
Name
Owned For
Owner Type
Purchase Details
Closed on
Nov 5, 2020
Sold by
Hickson James E
Bought by
Verrilli Anthony J and Verrilli Jonathan M
Current Estimated Value
Purchase Details
Closed on
Jun 29, 2017
Sold by
Roche Hideaway Village
Bought by
Hickson James E
Home Financials for this Owner
Home Financials are based on the most recent Mortgage that was taken out on this home.
Original Mortgage
$131,313
Interest Rate
4.02%
Mortgage Type
New Conventional
Purchase Details
Closed on
Jun 14, 2010
Sold by
Roche William T
Bought by
Roche William T and Mattingly Theodore
Purchase Details
Closed on
Jun 9, 2010
Sold by
Roche Helena R
Bought by
Roche William T
Purchase Details
Closed on
Oct 1, 2009
Sold by
Kadis Marc
Bought by
Roche William T
Purchase Details
Closed on
Aug 10, 2009
Sold by
Kennedy-Murphy Kerry and Roche William T
Bought by
Kadis Marc
Create a Home Valuation Report for This Property
The Home Valuation Report is an in-depth analysis detailing your home's value as well as a comparison with similar homes in the area
Home Values in the Area
Average Home Value in this Area
Purchase History
| Date | Buyer | Sale Price | Title Company |
|---|---|---|---|
| Verrilli Anthony J | $199,000 | None Available | |
| Hickson James E | $130,000 | -- | |
| Roche William T | -- | -- | |
| Roche William T | -- | -- | |
| Roche William T | -- | -- | |
| Kadis Marc | $4,957 | -- |
Source: Public Records
Mortgage History
| Date | Status | Borrower | Loan Amount |
|---|---|---|---|
| Previous Owner | Hickson James E | $131,313 |
Source: Public Records
Tax History Compared to Growth
Tax History
| Year | Tax Paid | Tax Assessment Tax Assessment Total Assessment is a certain percentage of the fair market value that is determined by local assessors to be the total taxable value of land and additions on the property. | Land | Improvement |
|---|---|---|---|---|
| 2025 | $2,398 | $307,000 | $0 | $307,000 |
| 2024 | $2,080 | $259,300 | $0 | $259,300 |
| 2023 | $1,812 | $205,700 | $0 | $205,700 |
| 2022 | $1,922 | $190,500 | $0 | $190,500 |
| 2021 | $1,899 | $176,300 | $0 | $176,300 |
| 2020 | $1,872 | $174,300 | $0 | $174,300 |
| 2019 | $1,641 | $156,100 | $0 | $156,100 |
| 2018 | $1,495 | $141,800 | $0 | $141,800 |
| 2017 | $1,170 | $113,600 | $0 | $113,600 |
| 2016 | $1,181 | $116,200 | $0 | $116,200 |
| 2015 | $1,170 | $116,200 | $0 | $116,200 |
Source: Public Records
Map
Nearby Homes
- 13 Hideaway Village Unit G
- 9 Hideaway Rd Unit F
- 27 Baker Ln Unit 27H
- 11 Thompson Rd Unit 11A
- 11 Thompson Rd Unit A
- 810 Head of The Bay Rd
- 23 Pine Ridge Rd
- 73 Lewis Point Rd
- 65 Lewis Point Rd
- 47 Lake Dr
- 0 Lewis Point Rd
- 14 Buttonwood Ln
- 41 Lewis Point Rd
- 110 Packard St
- 3 Wolf Rd
- 18 Martin St
- 56 Rip Van Winkle Way
- 171 Puritan Rd
- 162 Puritan Rd
- 17 Maple St
- 15S Baker Ln
- 15 S Bakers Ln Unit 15 S
- 15S Bakers Ln Unit 15S
- 15 Baker Ln
- 15 Baker Ln Unit S
- 15 Baker Ln Unit 15
- 15 Bakers Ln Unit 15 S
- 1 Hideaway Village
- 16 Hideaway Village
- 12 Hideaway Village Unit G
- 12 Hideaway Village Unit F
- 6 Hideaway Village Unit G
- 6 Hideaway Village Unit F
- 4 Hideaway Village Unit G
- 4 Hideaway Village Unit F
- 5H Bakers Ln Unit 5
- 5H Bakers Ln Unit H
- 2 Hideaway Village Unit 2h
- 2 Hideaway Village Unit H
- 9 Hideaway Village