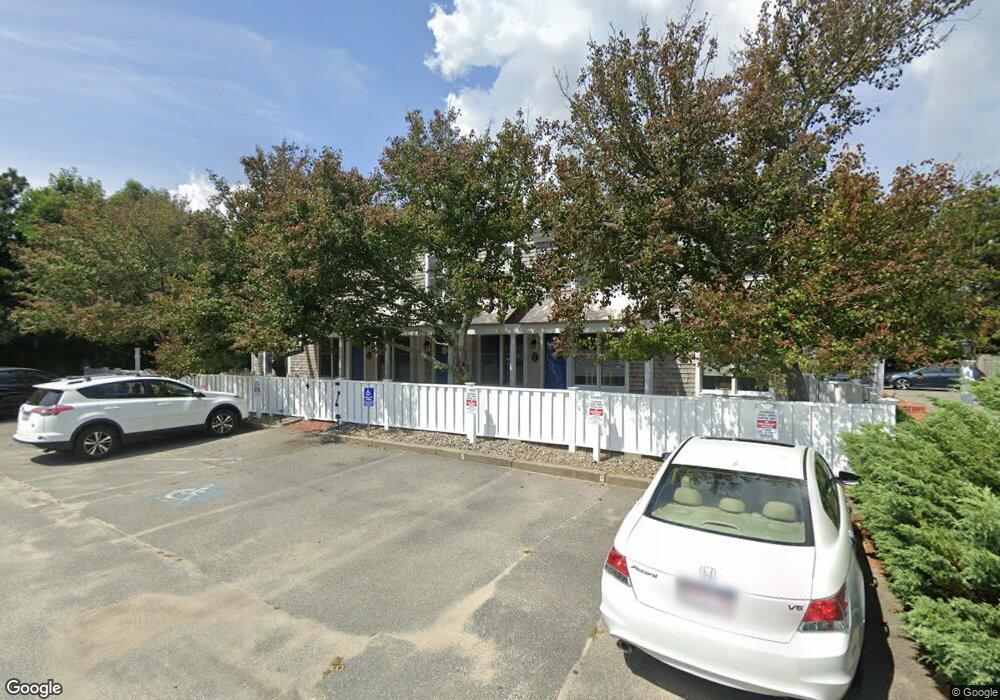
15 Balfour Ln Unit D Chatham, MA 02633
West Chatham NeighborhoodEstimated Value: $498,000 - $644,000
2
Beds
2
Baths
1,050
Sq Ft
$538/Sq Ft
Est. Value
About This Home
This home is located at 15 Balfour Ln Unit D, Chatham, MA 02633 and is currently estimated at $564,414, approximately $537 per square foot. 15 Balfour Ln Unit D is a home located in Barnstable County with nearby schools including Chatham Elementary School, Harwich Elementary School, and Monomoy Regional Middle School.
Ownership History
Date
Name
Owned For
Owner Type
Purchase Details
Closed on
Sep 28, 2016
Sold by
Bowen Erin M
Bought by
Bowen Erin M
Current Estimated Value
Purchase Details
Closed on
May 21, 2010
Sold by
Pennypacker Craig H
Bought by
Alicata Joseph A and Alicata Erin M
Home Financials for this Owner
Home Financials are based on the most recent Mortgage that was taken out on this home.
Original Mortgage
$188,000
Interest Rate
5.23%
Mortgage Type
Purchase Money Mortgage
Purchase Details
Closed on
May 6, 2002
Sold by
Kelley Kimberly J
Bought by
Pennypacker Craig H
Purchase Details
Closed on
May 4, 2000
Sold by
Kelley Scott C
Bought by
Kelley Kimberly J
Home Financials for this Owner
Home Financials are based on the most recent Mortgage that was taken out on this home.
Original Mortgage
$65,000
Interest Rate
8.21%
Mortgage Type
Purchase Money Mortgage
Purchase Details
Closed on
Feb 10, 1989
Sold by
Marsh William
Bought by
Kelley Scott C
Create a Home Valuation Report for This Property
The Home Valuation Report is an in-depth analysis detailing your home's value as well as a comparison with similar homes in the area
Home Values in the Area
Average Home Value in this Area
Purchase History
| Date | Buyer | Sale Price | Title Company |
|---|---|---|---|
| Bowen Erin M | -- | -- | |
| Bowen Erin M | -- | -- | |
| Alicata Joseph A | $235,000 | -- | |
| Alicata Joseph A | $235,000 | -- | |
| Pennypacker Craig H | $142,500 | -- | |
| Pennypacker Craig H | $142,500 | -- | |
| Kelley Kimberly J | $85,000 | -- | |
| Kelley Kimberly J | $85,000 | -- | |
| Kelley Scott C | $125,000 | -- | |
| Kelley Scott C | $125,000 | -- |
Source: Public Records
Mortgage History
| Date | Status | Borrower | Loan Amount |
|---|---|---|---|
| Previous Owner | Alicata Joseph A | $188,000 | |
| Previous Owner | Kelley Scott C | $65,000 |
Source: Public Records
Tax History Compared to Growth
Tax History
| Year | Tax Paid | Tax Assessment Tax Assessment Total Assessment is a certain percentage of the fair market value that is determined by local assessors to be the total taxable value of land and additions on the property. | Land | Improvement |
|---|---|---|---|---|
| 2025 | $1,509 | $434,800 | $0 | $434,800 |
| 2024 | $1,371 | $384,100 | $0 | $384,100 |
| 2023 | $1,070 | $275,900 | $0 | $275,900 |
| 2022 | $1,111 | $240,500 | $0 | $240,500 |
| 2021 | $1,123 | $225,500 | $0 | $225,500 |
| 2020 | $1,087 | $225,500 | $0 | $225,500 |
| 2019 | $1,083 | $223,400 | $0 | $223,400 |
| 2018 | $1,077 | $221,200 | $0 | $221,200 |
| 2017 | $1,114 | $221,500 | $0 | $221,500 |
| 2016 | $1,070 | $213,100 | $0 | $213,100 |
| 2015 | $1,053 | $211,000 | $0 | $211,000 |
| 2014 | $1,084 | $213,300 | $0 | $213,300 |
Source: Public Records
Map
Nearby Homes
- 14 Pond View Ln
- 99 Uncle Alberts Drive Extension
- 29 Jessies Landing
- 56 Skyline Dr
- 144 Barn Hill Rd
- 0 George Ryder Rd Unit 73104629
- 0 George Ryder Rd Unit 22301591
- 207 Horizon Dr
- 231 Crowell Rd
- 1761 Main St
- 745 Main St
- 39 Meadow Brook Rd
- 27 Martha Kendrick Dr
- 287 Cedar St
- 12 Pond St
- 85 Cedar St
- 36 Moonbeam Ln
- 292 Stage Harbor Rd
- 200 Hardings Beach Rd
- 230 Barcliff Ave
- 15 Balfour Ln Unit E
- 15 Balfour Ln Unit C
- 15 Balfour Ln Unit 4
- 15 Balfour Ln Unit 3
- 15 Balfour Ln Unit 2
- 15 Balfour Ln Unit XD
- 15 Balfour Ln
- 15 Balfour Ln Unit 1
- 7 Captains Row E
- 5 Captains Row E
- 3 Captains Row E
- 5 Captains Row E Unit 5
- 17 Balfour Ct
- 17 Balfour Ct Unit G
- 17 Balfour Ct Unit J
- 17 Balfour Ct Unit O
- 17 Balfour Ct Unit M
- 17 Balfour Ct Unit L
- 17 Balfour Ct Unit I
- 17 Balfour Ct Unit P