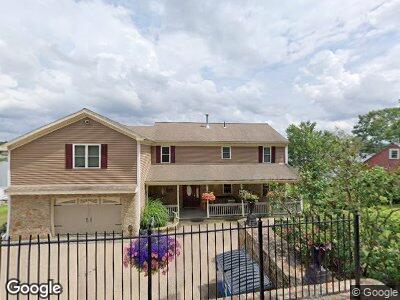
15 Bayberry Ln Millbury, MA 01527
Estimated Value: $833,000 - $905,000
3
Beds
2
Baths
2,412
Sq Ft
$357/Sq Ft
Est. Value
About This Home
This home is located at 15 Bayberry Ln, Millbury, MA 01527 and is currently estimated at $862,067, approximately $357 per square foot. 15 Bayberry Ln is a home located in Worcester County with nearby schools including Elmwood Street Elementary School, Raymond E. Shaw Elementary School, and Millbury Junior/Senior High School.
Ownership History
Date
Name
Owned For
Owner Type
Purchase Details
Closed on
Apr 10, 2003
Sold by
Granger Arthur R and Granger Dorothy A
Bought by
Granger Kevin
Current Estimated Value
Home Financials for this Owner
Home Financials are based on the most recent Mortgage that was taken out on this home.
Original Mortgage
$200,000
Outstanding Balance
$91,085
Interest Rate
5.86%
Mortgage Type
Purchase Money Mortgage
Estimated Equity
$695,207
Create a Home Valuation Report for This Property
The Home Valuation Report is an in-depth analysis detailing your home's value as well as a comparison with similar homes in the area
Home Values in the Area
Average Home Value in this Area
Purchase History
| Date | Buyer | Sale Price | Title Company |
|---|---|---|---|
| Granger Kevin | $200,000 | -- | |
| Granger Kevin | $200,000 | -- |
Source: Public Records
Mortgage History
| Date | Status | Borrower | Loan Amount |
|---|---|---|---|
| Open | Granger Kevin | $200,000 | |
| Closed | Granger Kevin | $200,000 |
Source: Public Records
Tax History Compared to Growth
Tax History
| Year | Tax Paid | Tax Assessment Tax Assessment Total Assessment is a certain percentage of the fair market value that is determined by local assessors to be the total taxable value of land and additions on the property. | Land | Improvement |
|---|---|---|---|---|
| 2025 | $10,984 | $820,281 | $335,381 | $484,900 |
| 2024 | $10,063 | $760,601 | $310,401 | $450,200 |
| 2023 | $8,680 | $600,669 | $214,169 | $386,500 |
| 2022 | $8,001 | $533,369 | $214,169 | $319,200 |
| 2021 | $7,968 | $516,369 | $214,169 | $302,200 |
| 2020 | $7,831 | $510,800 | $214,200 | $296,600 |
| 2019 | $8,351 | $526,900 | $213,300 | $313,600 |
| 2018 | $7,673 | $469,600 | $213,300 | $256,300 |
| 2017 | $7,443 | $453,000 | $222,600 | $230,400 |
| 2016 | $7,242 | $440,000 | $222,600 | $217,400 |
| 2015 | $7,310 | $444,100 | $236,700 | $207,400 |
| 2014 | $5,836 | $341,300 | $168,800 | $172,500 |
Source: Public Records
Map
Nearby Homes