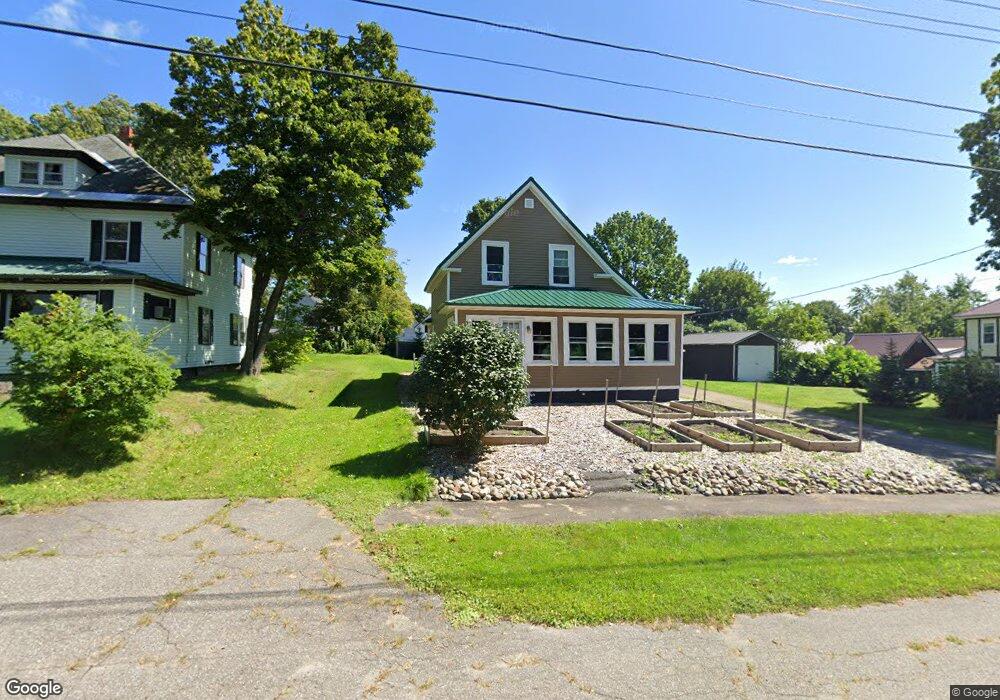
15 Beech St East Millinocket, ME 04430
Estimated Value: $70,150 - $187,000
3
Beds
2
Baths
1,100
Sq Ft
$118/Sq Ft
Est. Value
About This Home
This home is located at 15 Beech St, East Millinocket, ME 04430 and is currently estimated at $130,288, approximately $118 per square foot. 15 Beech St is a home located in Penobscot County with nearby schools including Opal Myrick Elementary School and Schenck High School.
Ownership History
Date
Name
Owned For
Owner Type
Purchase Details
Closed on
Jan 25, 2024
Sold by
Scott Vanessa D
Bought by
Scott Vanessa D and Scott Florencio Joseph
Current Estimated Value
Purchase Details
Closed on
Dec 7, 2007
Sold by
Noddin Howard L and Noddin Roxanne M
Bought by
Florencio Joseph J and Florencio Vanessa D
Home Financials for this Owner
Home Financials are based on the most recent Mortgage that was taken out on this home.
Original Mortgage
$41,080
Interest Rate
6.37%
Mortgage Type
FHA
Create a Home Valuation Report for This Property
The Home Valuation Report is an in-depth analysis detailing your home's value as well as a comparison with similar homes in the area
Home Values in the Area
Average Home Value in this Area
Purchase History
| Date | Buyer | Sale Price | Title Company |
|---|---|---|---|
| Scott Vanessa D | -- | None Available | |
| Scott Vanessa D | -- | None Available | |
| Florencio Joseph J | -- | -- | |
| Florencio Joseph J | -- | -- |
Source: Public Records
Mortgage History
| Date | Status | Borrower | Loan Amount |
|---|---|---|---|
| Previous Owner | Florencio Joseph J | $17,675 | |
| Previous Owner | Florencio Joseph J | $41,080 |
Source: Public Records
Tax History
| Year | Tax Paid | Tax Assessment Tax Assessment Total Assessment is a certain percentage of the fair market value that is determined by local assessors to be the total taxable value of land and additions on the property. | Land | Improvement |
|---|---|---|---|---|
| 2024 | $1,273 | $38,000 | $5,300 | $32,700 |
| 2023 | $969 | $29,192 | $4,094 | $25,098 |
| 2022 | $969 | $29,192 | $4,094 | $25,098 |
| 2021 | $969 | $29,192 | $4,094 | $25,098 |
| 2020 | $940 | $29,192 | $4,094 | $25,098 |
| 2019 | $883 | $29,192 | $4,094 | $25,098 |
| 2018 | $941 | $29,192 | $4,094 | $25,098 |
| 2017 | $978 | $29,192 | $4,094 | $25,098 |
| 2016 | $898 | $29,192 | $4,094 | $25,098 |
| 2015 | $866 | $29,192 | $4,094 | $25,098 |
| 2014 | $833 | $29,192 | $4,094 | $25,098 |
| 2013 | $719 | $32,800 | $4,600 | $28,200 |
Source: Public Records
Map
Nearby Homes
Your Personal Tour Guide
Ask me questions while you tour the home.