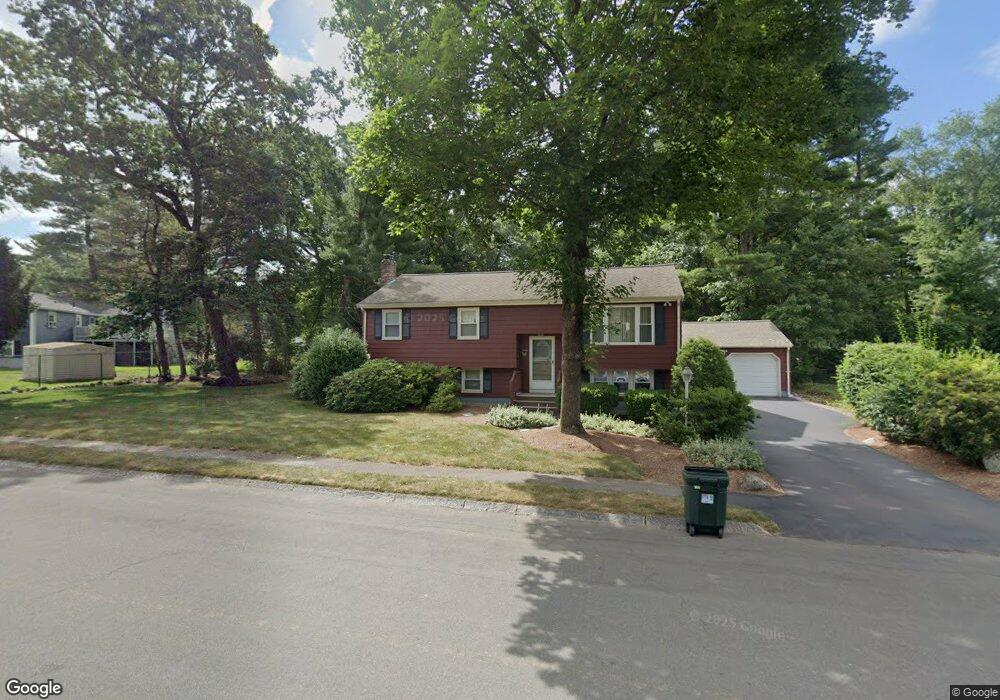
15 Borrows Rd Foxboro, MA 02035
Estimated Value: $626,069 - $682,000
3
Beds
3
Baths
1,080
Sq Ft
$606/Sq Ft
Est. Value
About This Home
This home is located at 15 Borrows Rd, Foxboro, MA 02035 and is currently estimated at $655,017, approximately $606 per square foot. 15 Borrows Rd is a home located in Norfolk County with nearby schools including Foxborough High School, Discovery Daycare Center, and Hands-On-Montessori School.
Ownership History
Date
Name
Owned For
Owner Type
Purchase Details
Closed on
Apr 8, 2025
Sold by
Weihrauch Nancy S and Weihrauch Erick S
Bought by
Weihrauch Ft and Weihrauch
Current Estimated Value
Purchase Details
Closed on
Apr 7, 2005
Sold by
Weihrauch Nancy S
Bought by
Weihrauch Erick S and Weihrauch Nancy S
Purchase Details
Closed on
Apr 5, 1996
Sold by
Wiggins Thomas R and Wiggins Barbara G
Bought by
Assoc Relocation Mgmt
Create a Home Valuation Report for This Property
The Home Valuation Report is an in-depth analysis detailing your home's value as well as a comparison with similar homes in the area
Home Values in the Area
Average Home Value in this Area
Purchase History
| Date | Buyer | Sale Price | Title Company |
|---|---|---|---|
| Weihrauch Ft | -- | None Available | |
| Weihrauch Ft | -- | None Available | |
| Weihrauch Erick S | -- | -- | |
| Weihrauch Erick S | -- | -- | |
| Assoc Relocation Mgmt | $170,500 | -- |
Source: Public Records
Mortgage History
| Date | Status | Borrower | Loan Amount |
|---|---|---|---|
| Previous Owner | Assoc Relocation Mgmt | $197,000 | |
| Previous Owner | Assoc Relocation Mgmt | $65,000 |
Source: Public Records
Tax History
| Year | Tax Paid | Tax Assessment Tax Assessment Total Assessment is a certain percentage of the fair market value that is determined by local assessors to be the total taxable value of land and additions on the property. | Land | Improvement |
|---|---|---|---|---|
| 2025 | $6,927 | $524,000 | $239,300 | $284,700 |
| 2024 | $6,602 | $488,700 | $243,700 | $245,000 |
| 2023 | $6,458 | $454,500 | $232,000 | $222,500 |
| 2022 | $5,850 | $402,900 | $194,500 | $208,400 |
| 2021 | $5,421 | $367,800 | $180,100 | $187,700 |
| 2020 | $5,072 | $348,100 | $180,100 | $168,000 |
| 2019 | $5,004 | $340,400 | $171,500 | $168,900 |
| 2018 | $4,875 | $334,600 | $171,500 | $163,100 |
| 2017 | $4,756 | $316,200 | $160,300 | $155,900 |
| 2016 | $4,812 | $324,700 | $161,600 | $163,100 |
| 2015 | $4,710 | $310,100 | $136,600 | $173,500 |
| 2014 | $4,515 | $301,200 | $127,700 | $173,500 |
Source: Public Records
Map
Nearby Homes
- 128 Tremont St
- 24 Maverick Dr
- 40 Treasure Island Rd
- 1769 West St
- 346 South St
- 16 Treasure Island Rd
- 85 Jewell St
- 33 Colonial Way
- 9 Coach Rd
- 84 Messenger St
- 46 Mirimichi St
- 150 Gilbert St
- 25 Munroe Dr
- 14 Claire Ave
- 28 Messenger St
- 263 Mansfield Rd
- 126 Washington St
- 130 Washington St
- 124 Washington St
- 158 Washington St
Your Personal Tour Guide
Ask me questions while you tour the home.