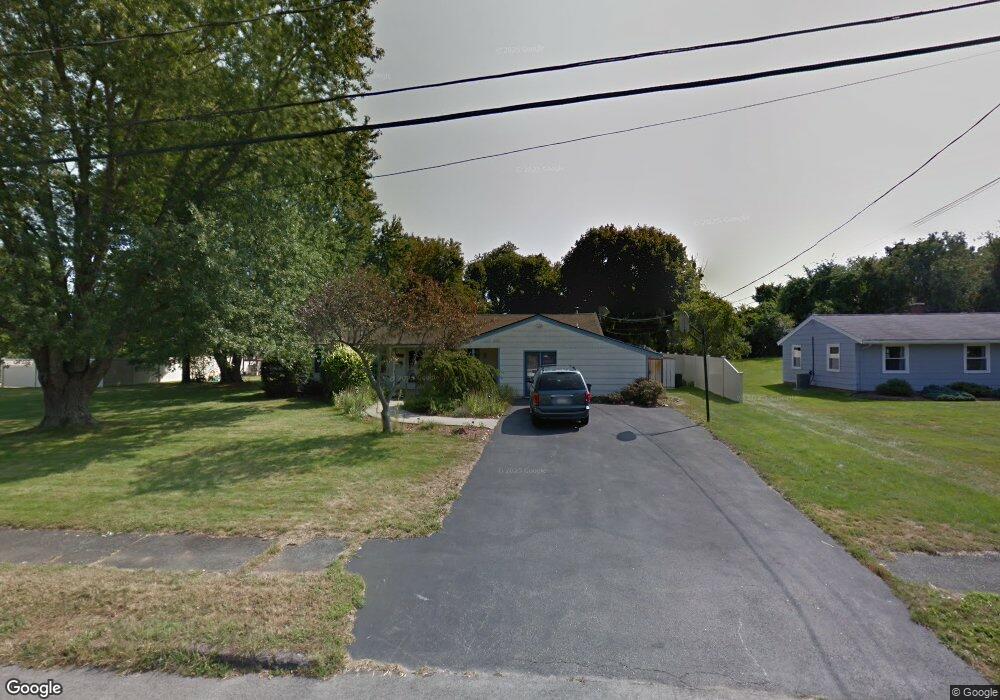
15 Bradford Rd Danvers, MA 01923
Estimated Value: $667,733 - $697,000
3
Beds
3
Baths
1,408
Sq Ft
$481/Sq Ft
Est. Value
About This Home
This home is located at 15 Bradford Rd, Danvers, MA 01923 and is currently estimated at $677,183, approximately $480 per square foot. 15 Bradford Rd is a home located in Essex County with nearby schools including Danvers High School, St. Mary of the Annunciation School, and North Shore Christian School.
Ownership History
Date
Name
Owned For
Owner Type
Purchase Details
Closed on
Jun 15, 2001
Sold by
Bovio Bette E and Bovio B
Bought by
Flint Stephen R and Flint Karen E
Current Estimated Value
Purchase Details
Closed on
Dec 12, 1997
Sold by
Fuller Robert T and Fuller Jane M
Bought by
Bovio Bette E
Purchase Details
Closed on
Jun 24, 1987
Sold by
Hutchinson Bruce T
Bought by
Fuller Robert T
Create a Home Valuation Report for This Property
The Home Valuation Report is an in-depth analysis detailing your home's value as well as a comparison with similar homes in the area
Home Values in the Area
Average Home Value in this Area
Purchase History
| Date | Buyer | Sale Price | Title Company |
|---|---|---|---|
| Flint Stephen R | $260,000 | -- | |
| Bovio Bette E | $180,000 | -- | |
| Fuller Robert T | $160,500 | -- |
Source: Public Records
Mortgage History
| Date | Status | Borrower | Loan Amount |
|---|---|---|---|
| Open | Fuller Robert T | $243,195 | |
| Closed | Fuller Robert T | $262,000 |
Source: Public Records
Tax History
| Year | Tax Paid | Tax Assessment Tax Assessment Total Assessment is a certain percentage of the fair market value that is determined by local assessors to be the total taxable value of land and additions on the property. | Land | Improvement |
|---|---|---|---|---|
| 2025 | $6,376 | $580,200 | $379,400 | $200,800 |
| 2024 | $6,420 | $577,900 | $379,400 | $198,500 |
| 2023 | $6,225 | $529,800 | $344,800 | $185,000 |
| 2022 | $6,096 | $481,500 | $312,800 | $168,700 |
| 2021 | $5,867 | $439,500 | $296,300 | $143,200 |
| 2020 | $5,695 | $436,100 | $292,900 | $143,200 |
| 2019 | $5,438 | $409,500 | $266,300 | $143,200 |
| 2018 | $5,277 | $389,700 | $263,600 | $126,100 |
| 2017 | $4,866 | $342,900 | $230,300 | $112,600 |
| 2016 | $4,641 | $326,800 | $219,700 | $107,100 |
| 2015 | $4,419 | $296,400 | $199,700 | $96,700 |
Source: Public Records
Map
Nearby Homes
- 12 Tulane Rd
- 6 Colby Rd
- 55 Burley St
- 14 Grove St
- 2 Chapel Rd
- 35 Locust St Unit 3
- 4 Chatham Ln
- 5 Main Dr
- 20 Central Ave
- 10 Cottage Ave
- 14 Chase St
- 78 North St
- 22 Maple Ave
- 6 Venice St Unit B3
- 35 High St Unit 3D
- 44 Foster St
- 4 Duck Pond Rd Unit 225
- 34 Bayview Terrace Unit 5
- 43 Hobart St Unit B
- 5 Holten St
Your Personal Tour Guide
Ask me questions while you tour the home.